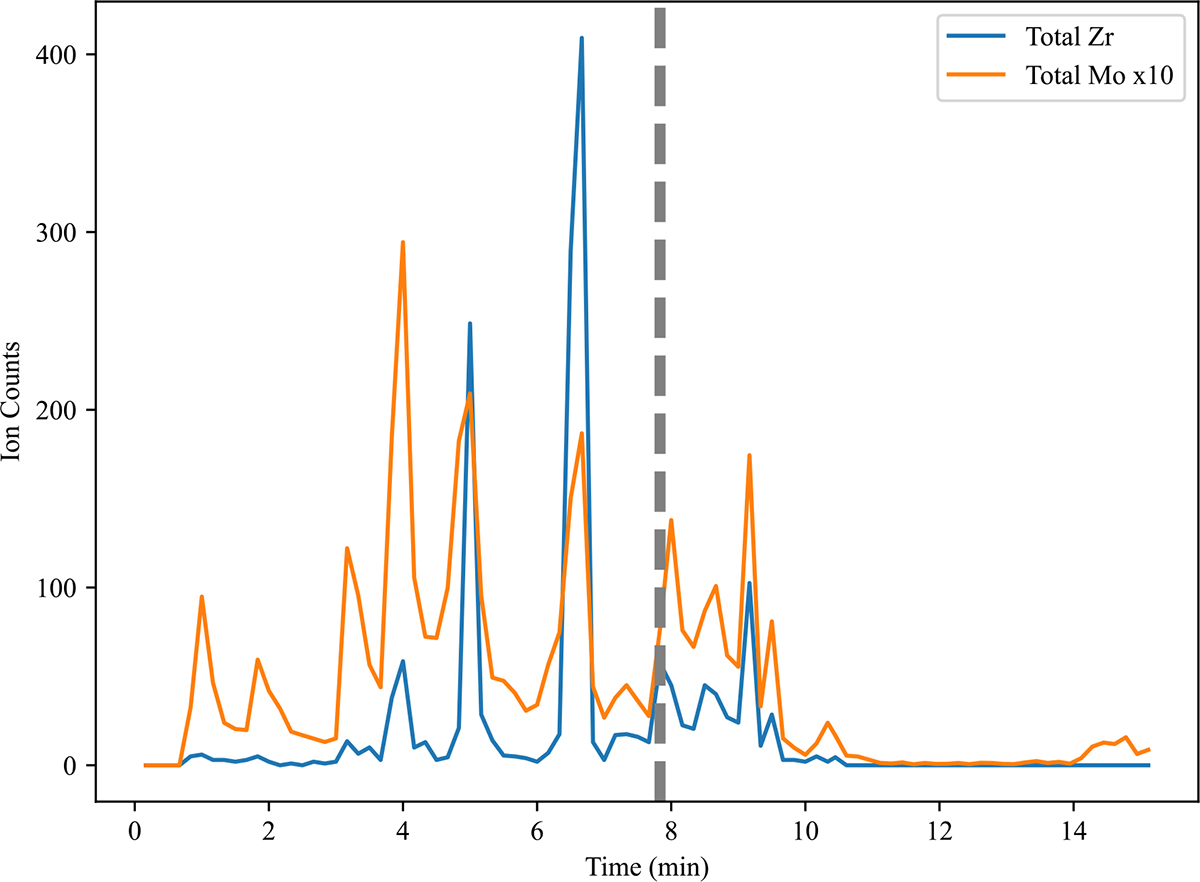
Fig. A.1.
Download original image
Time variation in Zr and Mo counts in grain KFC1h-343. The total counts from all isotopes of Mo and Zr (shown as orange and blue, respectively) are plotted against the time of measurement. For clarity, the Mo counts are scaled down by ten. The dashed, vertical grey line represents the time corresponding to the region of the grain that showed excess in 96Zr.
Current usage metrics show cumulative count of Article Views (full-text article views including HTML views, PDF and ePub downloads, according to the available data) and Abstracts Views on Vision4Press platform.
Data correspond to usage on the plateform after 2015. The current usage metrics is available 48-96 hours after online publication and is updated daily on week days.
Initial download of the metrics may take a while.