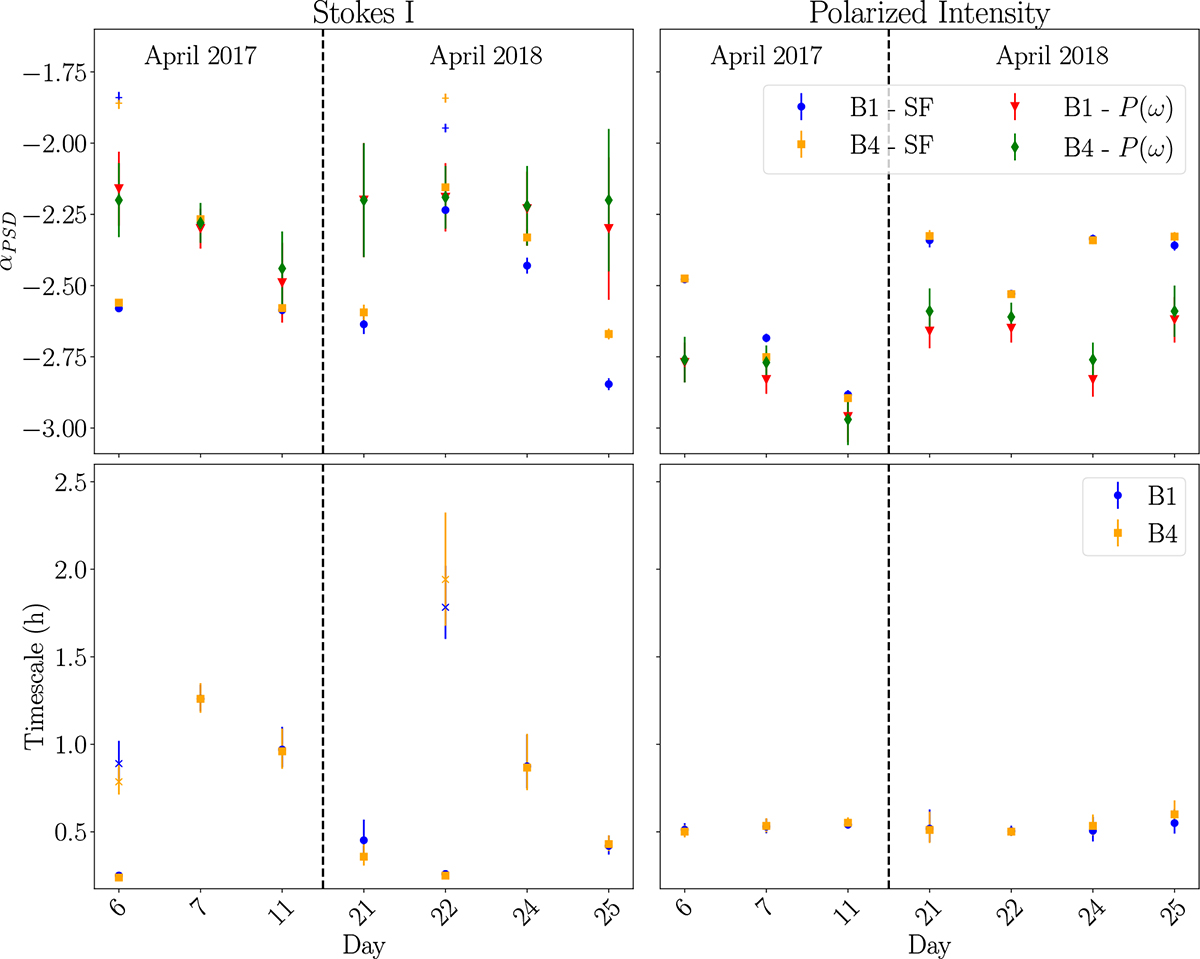
Fig. 11.
Download original image
PSD slope index (top) and timescales (bottom) estimated from the SF of the total intensity (left) and polarized intensity (right) 2017 and 2018 light curves, for the spectral bands B1 (blue dots) and B4 (orange squares). A second characteristic PSD and timescale, derived from the Stokes I SF, are marked with a cross (x). PSD values are computed from the SF slope as αPSD = −(1 + αSF) (blue dots and orange squares for the spectral bands B1 and B4, respectively), and from the HPF periodogram (red triangles and green diamonds for the spectral bands B1 and B4, respectively; see Appendix G).
Current usage metrics show cumulative count of Article Views (full-text article views including HTML views, PDF and ePub downloads, according to the available data) and Abstracts Views on Vision4Press platform.
Data correspond to usage on the plateform after 2015. The current usage metrics is available 48-96 hours after online publication and is updated daily on week days.
Initial download of the metrics may take a while.