Fig. 14.
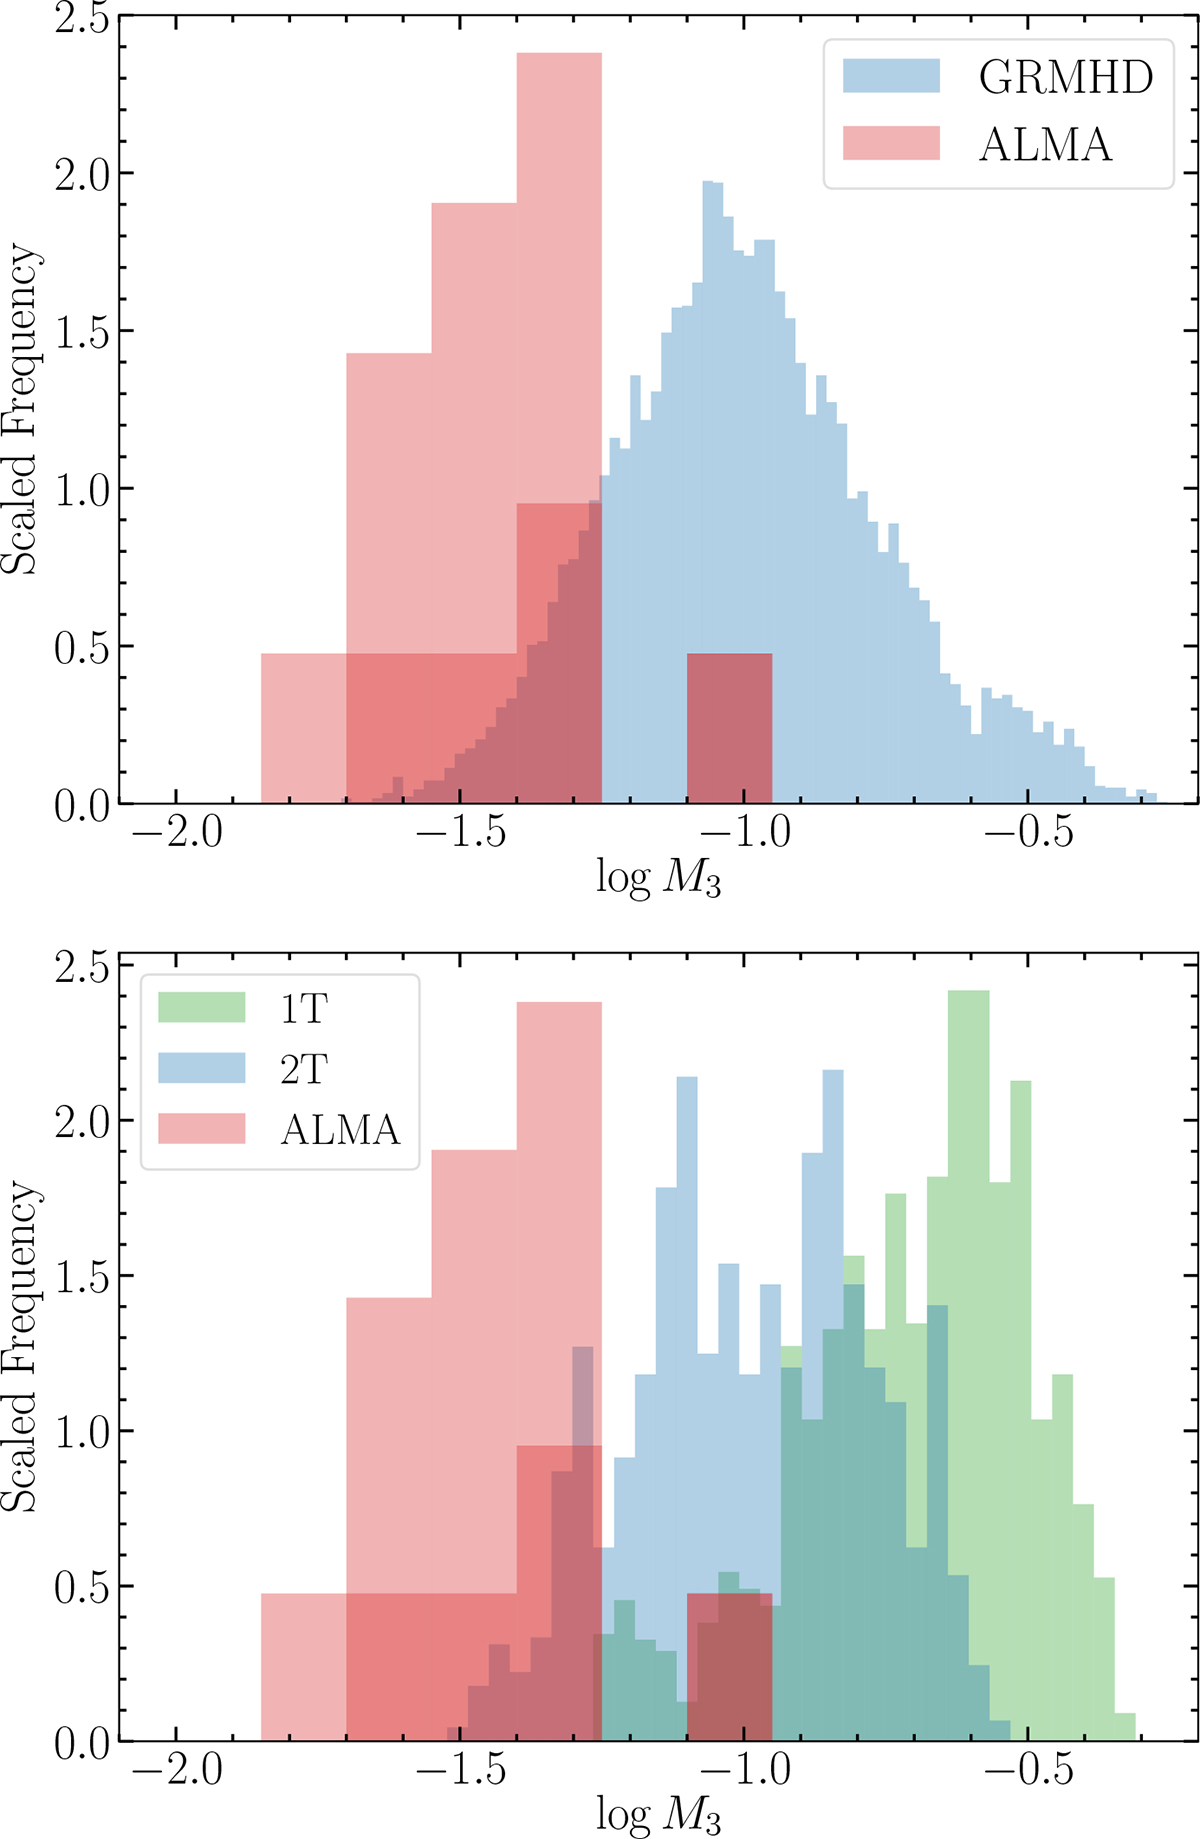
Download original image
Distribution of M3 in ALMA observations taken during the 2017 and 2018 EHT campaigns, compared to the distributions from different GRMHD models. The top panel shows the comparison with the EHT library of GRMHD models, while the bottom panel shows the comparison with the 1T and 2T GRMHD models from Salas et al. (2025). The dark red part of the observational histogram represents the 2017 ALMA data from Wielgus et al. (2022a), and the light red part corresponds to the 2018 results introduced in this paper.
Current usage metrics show cumulative count of Article Views (full-text article views including HTML views, PDF and ePub downloads, according to the available data) and Abstracts Views on Vision4Press platform.
Data correspond to usage on the plateform after 2015. The current usage metrics is available 48-96 hours after online publication and is updated daily on week days.
Initial download of the metrics may take a while.