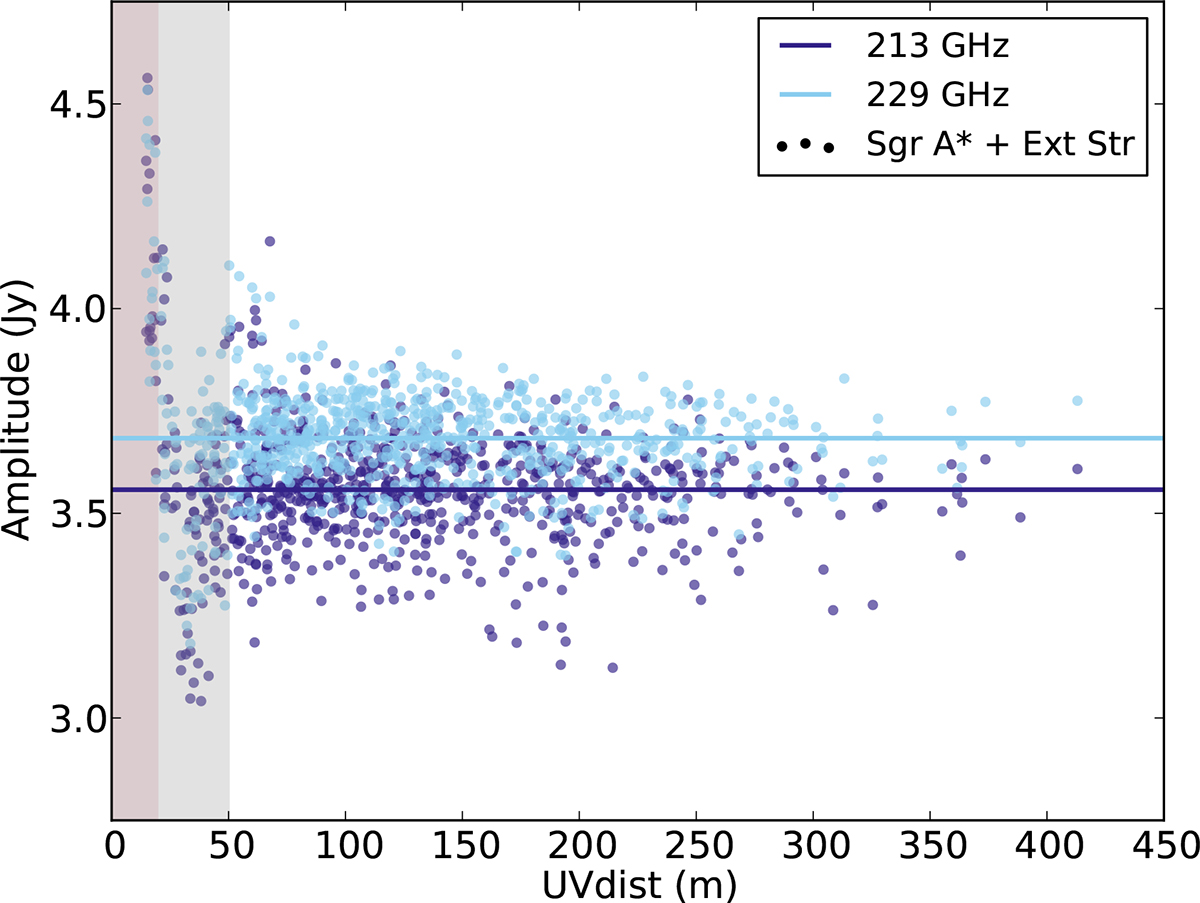
Fig. C.1.
Download original image
Snapshot of the calibrated data for Sgr A* at 7:23 UTC on April 25 from the SEFD-based data reduction. The colored circles represent the combined visibilities of the minispiral and Sgr A*. The solid colored lines are the mean flux density in each spectral window. The gray-shaded area represents the range of visibilities we consider for the minispiral (0-50 m). The red-shaded area represents the flagging cutoff for the extended structure used by SMA (0-30 kλ).
Current usage metrics show cumulative count of Article Views (full-text article views including HTML views, PDF and ePub downloads, according to the available data) and Abstracts Views on Vision4Press platform.
Data correspond to usage on the plateform after 2015. The current usage metrics is available 48-96 hours after online publication and is updated daily on week days.
Initial download of the metrics may take a while.