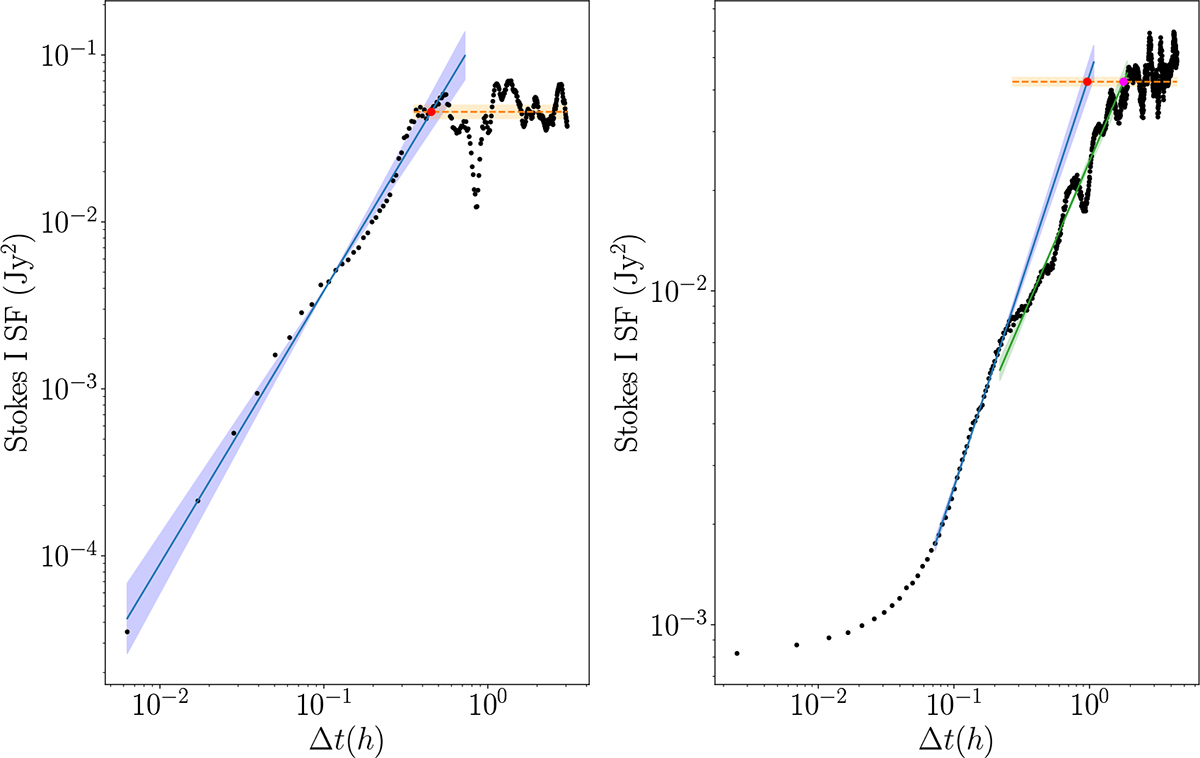
Fig. F.1.
Download original image
Sample of SF fitted to retrieve the slope (blue line, with an area corresponding to the 3σ level), the plateau level (orange line) and the timescales (red point, marking the intersection of the slope and the plateau). Left: SF of the April 21 Stokes I denoised light curve. Right: SF of the April 22 Stokes I light curve; we note two distinct slopes, fitted independently (the second slope corresponds to the green line).
Current usage metrics show cumulative count of Article Views (full-text article views including HTML views, PDF and ePub downloads, according to the available data) and Abstracts Views on Vision4Press platform.
Data correspond to usage on the plateform after 2015. The current usage metrics is available 48-96 hours after online publication and is updated daily on week days.
Initial download of the metrics may take a while.