Fig. H.1.
Download original image
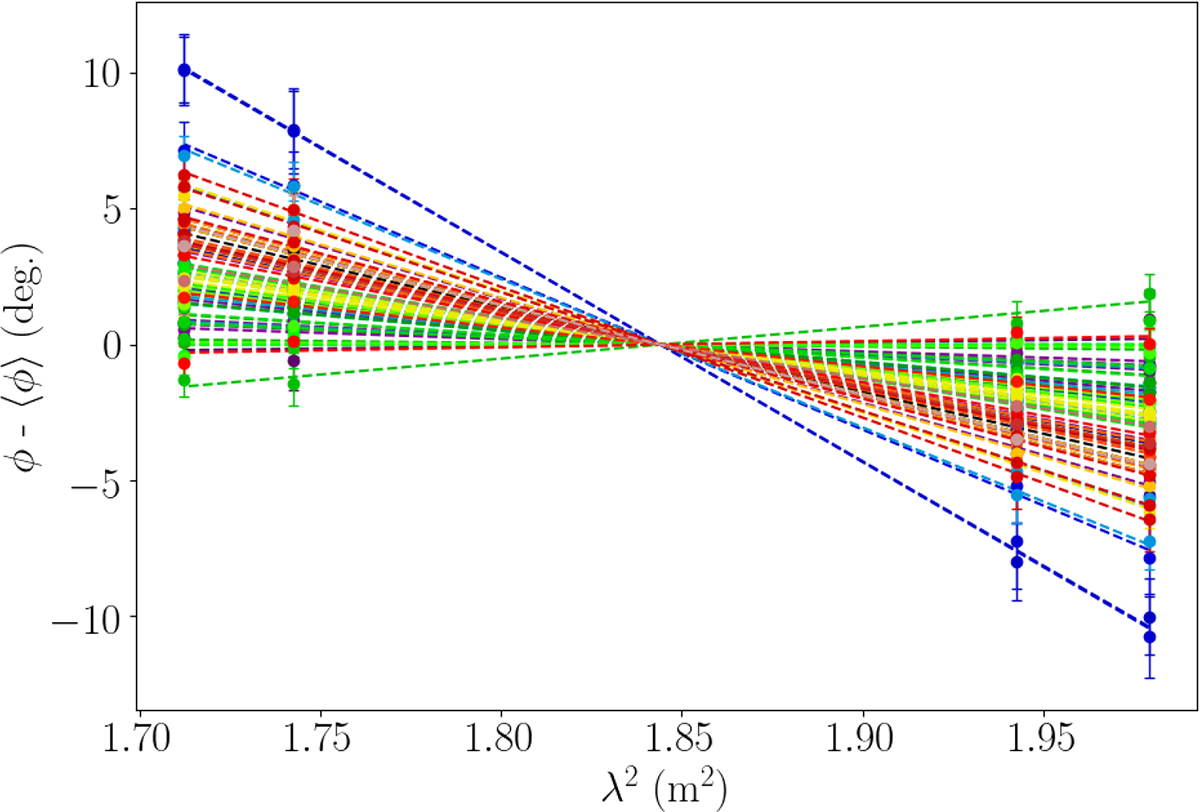
Sample of Sgr A* EVPA measurements across the four ALMA spectral bands (B1–B4) from the four observing days of the 2018 EHT campaign. The EVPA values for each time sample have been mean-subtracted to emphasize the relative variation across frequency. The dashed lines represent the best-fit linear models of the form ϕ(λ) = ϕ0 − RM(λ2 − λ02), used to estimate the RM evolution curves.
Current usage metrics show cumulative count of Article Views (full-text article views including HTML views, PDF and ePub downloads, according to the available data) and Abstracts Views on Vision4Press platform.
Data correspond to usage on the plateform after 2015. The current usage metrics is available 48-96 hours after online publication and is updated daily on week days.
Initial download of the metrics may take a while.