Open Access
Fig. H.2.
Download original image
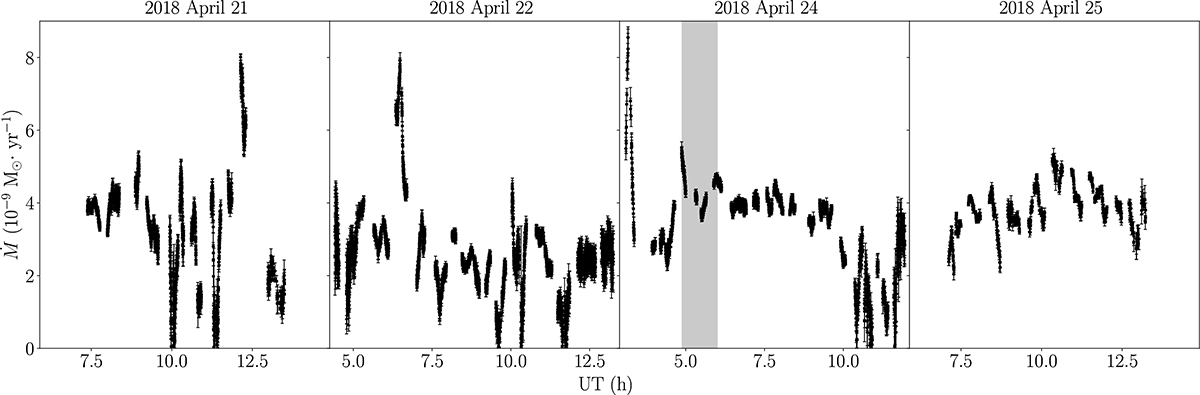
Sgr A* accretion rate evolution through the ALMA 2018 observations, estimated from the RM light curve presented in Fig. 4, using the accretion flow model presented in Marrone et al. (2006). The gray-shaded band on April 24 marks the time range of the Chandra X-ray flare.
Current usage metrics show cumulative count of Article Views (full-text article views including HTML views, PDF and ePub downloads, according to the available data) and Abstracts Views on Vision4Press platform.
Data correspond to usage on the plateform after 2015. The current usage metrics is available 48-96 hours after online publication and is updated daily on week days.
Initial download of the metrics may take a while.