Fig. 4.
Download original image
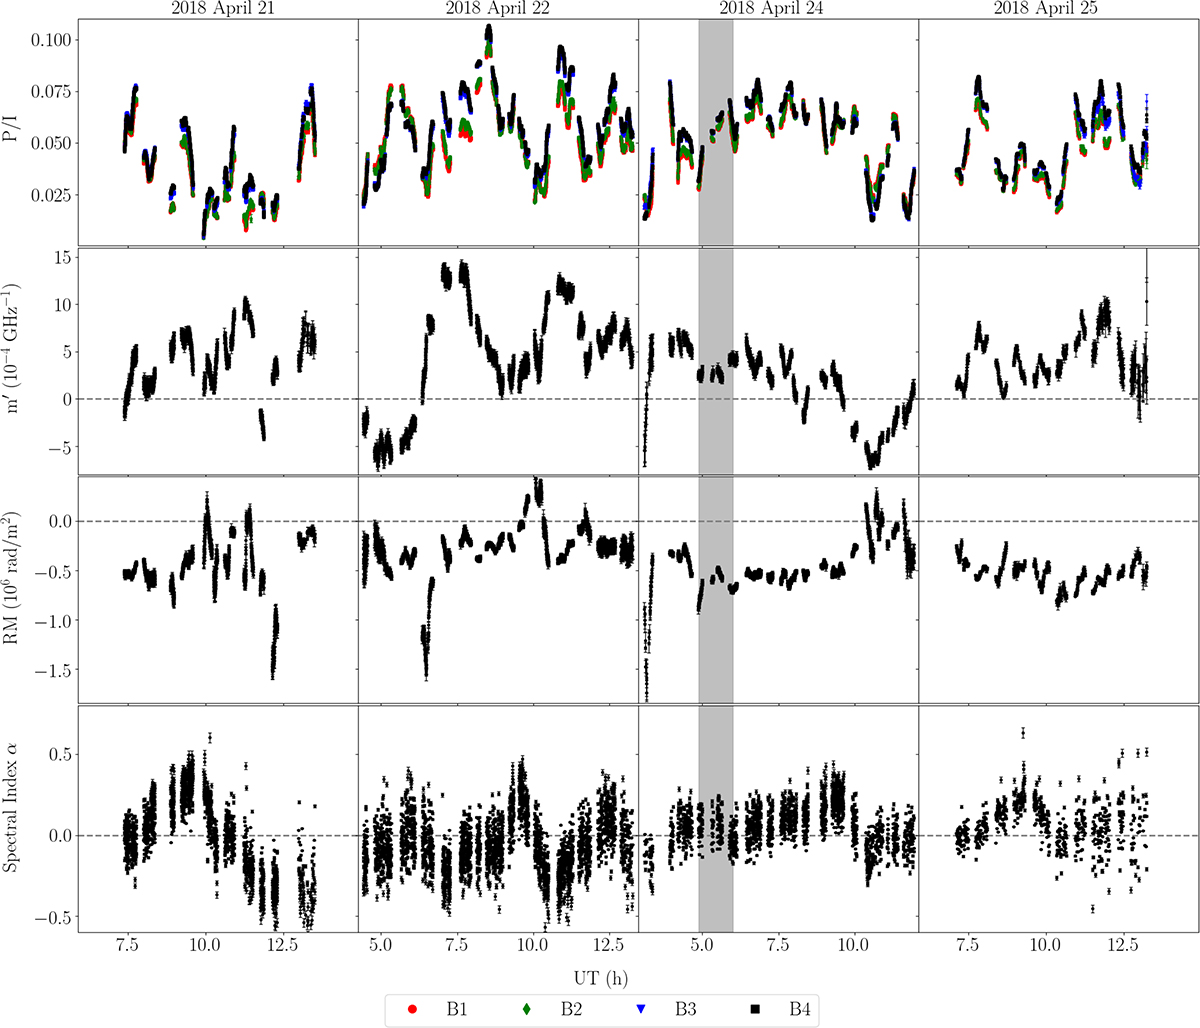
Sgr A* ALMA light curves of the fractional polarization for the four spectral bands, the depolarization measure, the rotation measure, and the spectral index (from top to bottom) for all four days (from left to right, April 21, 22, 24, and 25). The gray-shaded band on April 24 marks the time range of the Chandra X-ray flare.
Current usage metrics show cumulative count of Article Views (full-text article views including HTML views, PDF and ePub downloads, according to the available data) and Abstracts Views on Vision4Press platform.
Data correspond to usage on the plateform after 2015. The current usage metrics is available 48-96 hours after online publication and is updated daily on week days.
Initial download of the metrics may take a while.