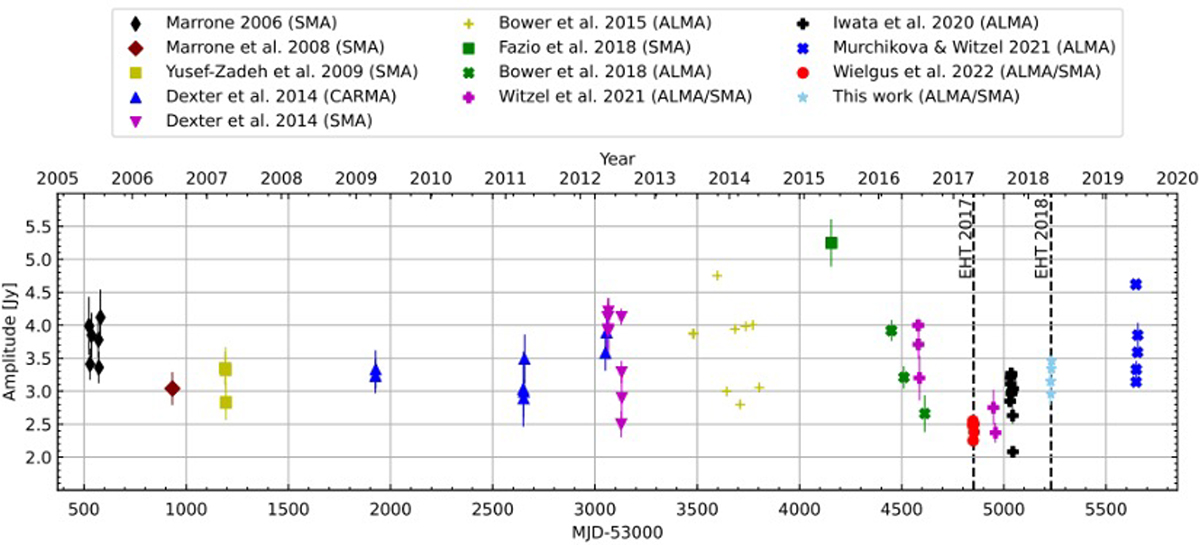
Fig. 5.
Download original image
Historical 230 GHz amplitude measurements of Sgr A* from 2005 to 2019 in Table 4 of Wielgus et al. (2022a) and average flux density and standard deviation from Table E.1. The 2017 and 2018 EHT observing campaigns are marked by black vertical lines. Standard deviations for both the 2017 and 2018 EHT observations are plotted, but are too small to be visible.
Current usage metrics show cumulative count of Article Views (full-text article views including HTML views, PDF and ePub downloads, according to the available data) and Abstracts Views on Vision4Press platform.
Data correspond to usage on the plateform after 2015. The current usage metrics is available 48-96 hours after online publication and is updated daily on week days.
Initial download of the metrics may take a while.