Fig. 1.
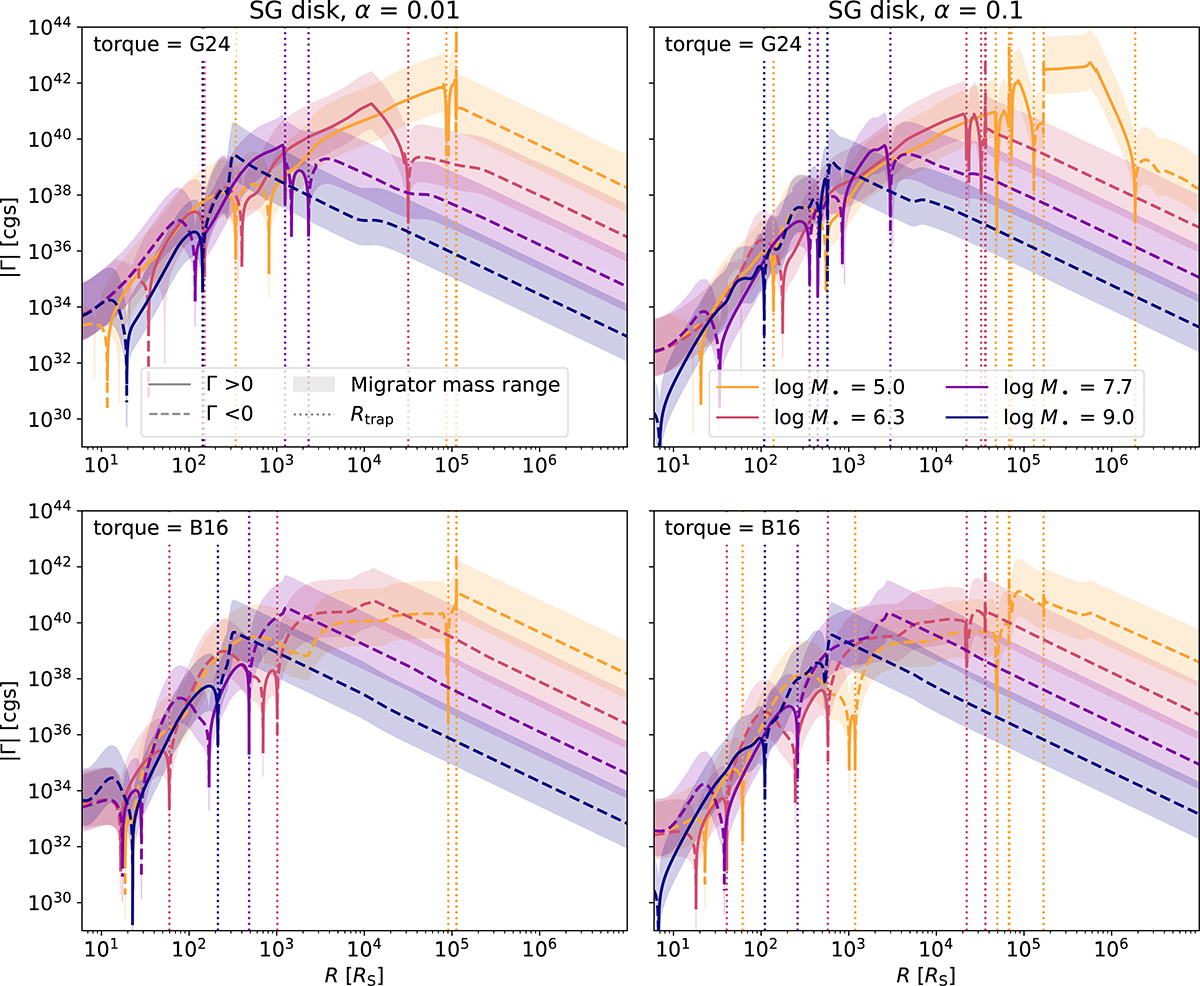
Download original image
Examples of torque profiles as a function of radial distance (in Schwarzschild radii) for BHs embedded in a SG disk. Each plot corresponds to a different combination of torque prescription (top: G24; bottom: B16), disk viscosity parameter α (left: α = 0.01; right: α = 0.1) and SMBH mass (log M•/M⊙ = 5.0, 6.3, 7.7, 9.0, represented in different colors). Solid and dashed lines indicate positive and negative net torques, respectively, while shaded regions denote uncertainty in the torque determined by computing it over a range of migrator masses between 5 M⊙ and 50 M⊙. Vertical dotted lines mark the locations of migration traps.
Current usage metrics show cumulative count of Article Views (full-text article views including HTML views, PDF and ePub downloads, according to the available data) and Abstracts Views on Vision4Press platform.
Data correspond to usage on the plateform after 2015. The current usage metrics is available 48-96 hours after online publication and is updated daily on week days.
Initial download of the metrics may take a while.