| Issue |
A&A
Volume 708, April 2026
|
|
|---|---|---|
| Article Number | A171 | |
| Number of page(s) | 16 | |
| Section | Astrophysical processes | |
| DOI | https://doi.org/10.1051/0004-6361/202556761 | |
| Published online | 03 April 2026 | |
The role of migration traps in the formation of binary black holes in AGN disks
1
Universität Heidelberg, Zentrum für Astronomie (ZAH), Institut für Theoretische Astrophysik, Albert-Ueberle-Str. 2, 69120 Heidelberg, Germany
2
Universität Heidelberg, Interdisziplinäres Zentrum für Wissenschaftliches Rechnen, Heidelberg, Germany
3
Physics and Astronomy Department Galileo Galilei, University of Padova, Vicolo dell’Osservatorio 3, I–35122 Padova, Italy
4
INFN, Sezione di Padova, Via Marzolo 8, I–35131 Padova, Italy
★ Corresponding author: This email address is being protected from spambots. You need JavaScript enabled to view it.
Received:
5
August
2025
Accepted:
26
February
2026
Abstract
Binary black holes (BBHs) forming in the accretion disks of active galactic nuclei (AGNs) represent a promising channel for gravitational-wave production. BBHs are often assumed to form at migration traps, i.e., radial locations where the Type I migration of embedded stellar-mass black holes (BHs) transitions from outward to inward. For this study, we tested this assumption by explicitly simulating the radial migration of BH pairs in AGN disks under different torque prescriptions, including thermal effects and the switch to Type II migration. We mapped where and when binaries form as a function of supermassive BH (SMBH) mass, disk viscosity, and migrating BH mass. We find that, for SMBH masses below M•thr ∼ 108 M⊙, the majority of pair-up events occur near migration traps (≳80%). In contrast, for higher SMBH masses, differential migration dominates and off-trap pair-ups can prevail. Certain disk configurations (e.g., α = 0.01, M• < 106 M⊙) present a significant overdensity of pair-ups even in the absence of traps due to traffic-jam accumulations where the gamma profile changes slope sharply. We also investigated hierarchical BBH formation, showing that higher-generation pair-ups cluster more tightly around trap or traffic-jam radii. Our results provide realistic prescriptions for BBH pair-up locations and timescales, highlighting the limitations of assuming fixed BBH formation sites.
Key words: black hole physics / gravitational waves / stars: black holes / stars: kinematics and dynamics / galaxies: active
© The Authors 2026
 Open Access article, published by EDP Sciences, under the terms of the Creative Commons Attribution License (https://creativecommons.org/licenses/by/4.0), which permits unrestricted use, distribution, and reproduction in any medium, provided the original work is properly cited.
This article is published in open access under the Subscribe to Open model. This email address is being protected from spambots. You need JavaScript enabled to view it. to support open access publication.
1. Introduction
The direct detection of gravitational waves (GWs) by the LIGO and Virgo collaborations has revolutionized our ability to study compact object populations in the Universe, most notably binary black holes (BBHs, Abbott et al. 2023a,b). As the catalog of GW events continues to grow, a pressing challenge is to identify and characterize the astrophysical environments in which such binaries form and evolve.
One particularly promising environment for BBH formation is the accretion disk of an active galactic nucleus (AGN), where a gas-rich and high-density environment provides ideal conditions for dynamical interactions among black holes (BHs, e.g., McKernan et al. 2012, 2025; Bartos et al. 2017; Stone et al. 2017; Yang et al. 2019a; Secunda et al. 2020; Tagawa et al. 2020a,b, 2023; Samsing et al. 2022; Vaccaro et al. 2024; Cook et al. 2025; Delfavero et al. 2025; Dittmann et al. 2025; Xue et al. 2025). Indeed, stellar-mass BHs can become embedded in the gaseous disk surrounding a supermassive BH (SMBH, Wang et al. 2024; Rowan et al. 2025a; Whitehead et al. 2025) and thus interact gravitationally with the disk, experiencing migration torques analogous to those governing planetary migration in protoplanetary disks (Paardekooper et al. 2010; McKernan et al. 2012; Bellovary et al. 2016; Masset 2017; Grishin et al. 2024).
As BHs migrate radially within the disk, the probability of close encounters and subsequent pair-up into binaries is enhanced (DeLaurentiis et al. 2023; Li et al. 2023; Rozner et al. 2023; Rowan et al. 2023, 2024; Whitehead et al. 2024b,a). Furthermore, the dissipation of orbital energy through gas drag and GW emission can efficiently harden such binaries, leading to mergers within the AGN’s lifetime (Peters 1964; Tiede et al. 2020; Ishibashi & Gröbner 2020, 2024; Rozner & Perets 2024; Rowan et al. 2025b).
BBH pair-up in AGN disks can occur either within migration traps – special radial locations where the total torque acting on a BH vanishes, halting its migration and promoting accumulation of several BHs – or throughout other regions of the disk, collectively referred to as “the bulk” (Wang et al. 2021). When two BHs migrate at different rates through the AGN disk, a process we refer to as differential migration, their radial paths may intersect. This increases the likelihood of close encounters that, under the influence of gas drag and GW emission, result in BBH formation. McKernan et al. (2020) find that more than 50% of BBH mergers originate in the bulk, but hierarchical mergers are efficient primarily within migration traps. Furthermore, Tagawa et al. (2020b) demonstrate that BBHs forming in the bulk through gas dynamical capture tend to migrate toward the migration trap as they harden.
Existing semi-analytical approaches focusing on the hierarchical merger scenario, including the FASTCLUSTER population synthesis tool developed by the authors (Mapelli et al. 2021, 2022; Vaccaro et al. 2024; Torniamenti et al. 2024), assign pair-ups to precomputed trap locations. While computationally convenient, this approach limits the physical realism of model outputs, especially for predicting the spatial distributions and formation times of merging binaries.
For this study, instead, we explicitly integrated BH migration trajectories within AGN disks. We used the Sirko & Goodman (2003) model to describe the disk structure and employed the publicly available pAGN module (Gangardt et al. 2024) to compute self-consistent radial profiles of gas surface density, temperature, and pressure. We evaluated migration torques using both a classical Type I prescription (Paardekooper et al. 2010; Bellovary et al. 2016) and an updated formulation including thermal effects (Masset 2017; Grishin et al. 2024). We accounted for transitions to Type II migration under gap-opening conditions (Lin & Papaloizou 1993; Bryden et al. 1999; McKernan et al. 2014; Vaccaro et al. 2024; Gilbaum et al. 2025).
We simulated millions of independent BH pairs, drawn from a mass distribution generated with population-synthesis calculations (Iorio et al. 2023), and tracked their one-dimensional migration under gravitational torques. We accounted for differential migration rates between BHs of varying masses, and identified binary formation using a combination of Hill-stability and orbit-crossing criteria. We further incorporated hierarchical evolution by seeding higher-generation (Ng) BHs based on the merger outcomes of first-generation (1g) binaries, including recoil kicks (Maggiore 2018).
Our main objective is to quantify the spatial distribution of BBH pair-ups across a broad parameter space. This includes variations in SMBH mass, disk viscosity, torque prescription, and BH mass. Our results provide realistic prescriptions for pair-up radii and timescales, which can be incorporated into semi-analytic population synthesis codes to improve merger rate predictions and GW data interpretation.
2. Methods
2.1. Disk structure
We modeled the physical properties of the accretion disk using the widely accredited steady-state analytic Sirko & Goodman (2003) disk model (hereafter SG). We solved the corresponding one-dimensional equations self-consistently via the pAGN module for the Python programming language (Gangardt et al. 2024) for given input parameters such as the mass of the central SMBH, M•, and the viscosity coefficient, α. We fixed the mass accretion rate to a tenth of the Eddington rate,  . We obtained radial profiles for the gas surface density, Σgas, the disk aspect ratio, h = H/R (defined as the ratio between the height of the disk, H(R), and its radius, R), the temperature, T, and the sound speed, cs.
Self-consistent solutions are crucial, as approximate treatments can lead to large deviations in these profiles, which in turn dramatically affect predictions for BBH formation in AGN disks, as discussed in Appendix A.
2.2. Migration torques
We explicitly computed the torques felt by an embedded object of mass m at a radial distance R from a SMBH of mass M•. We included the effects of Type I migration caused by the gravitational perturbation of embedded BHs in the disk (Paardekooper et al. 2010; Lyra et al. 2010; Jiménez & Masset 2017), accounting also for thermal migration, caused by the thermal response of the disk to the cold, overdense accretion disks surrounding embedded BHs (Masset 2017). The overall torque is
 (1)
(1)
We investigated the difference between a classical Type I migration prescription, inspired by the work by Bellovary et al. (2016, hereafter B16), and one that also accounts for vertical and thermal effects, similar to Grishin et al. (2024, hereafter G24). The classical Type I migration torques were computed according to B16 as
 (2)
(2)
where the parameter Θ was computed according to Lyra et al. (2010) as1
 (3)
(3)
and the isothermal Γiso and adiabatic Γad torques are functions of the adiabatic index γ (assumed to be equal to 5/3 throughout this work) and the gradients of local surface density Σg, and temperature T
 (4)
(4)
as
 (5)
(5)
 (6)
(6)
Jiménez & Masset (2017) incorporated three-dimensional effects in their Type I migration torque,
 (7)
(7)
and also accounted for the Lindblad torque ΓL as
 (8)
(8)
where
 (9)
(9)
We took the electron-scattering opacity as κ = 0.34 cm2/g as in Gangardt et al. (2024).
The thermal torques were computed as (Masset 2017; Velasco Romero & Masset 2020)
 (10)
(10)
where mc = csχ/G is a critical mass, τV is the vertical optical depth, xc is the corotational radius of the embedded body and λ is the typical size of overdense regions surrounding embedded BHs, evaluated as in G24:
 (11)
(11)
We assumed that the embedded BH emits at Eddington luminosity, L = LEdd = 4πGmc/κ, and took Lc = 4πGmρχ/γ as the critical luminosity (Masset 2017).
All migration torques are normalized by
 (12)
(12)
We identified migration traps as locations in the disk where the total Type I migration torque Γ crosses zero, changing sign from positive to negative. These correspond to regions where BHs tend to accumulate. In contrast, locations where Γ changes sign from negative to positive are referred to as anti-traps, as they tend to be depleted of BHs.
We also accounted for the possibility of switching to Type II migration. Namely, we enforced a joint condition on the gas viscosity, migrator mass and local disk thinness, (Crida et al. 2006)
 (13)
(13)
If this condition is met, the migrator opens a gap in the disk and can no longer be subject to the migration torque Γ. Instead, conservatively assuming that no gas can cross the gap, its migration follows the viscous evolution of the disk’s gas, moving inwards on a timescale (McKernan et al. 2012)
 (14)
(14)
Our prescription for the disk profile does not allow us to self-consistently open a gap (i.e., set Σgas(R)≃0 locally), hence in case of Type II migration we artificially constructed the corresponding torque as the rate of change in angular momentum, L = mR2Ω,
 (15)
(15)
We discuss the validity and impact of this assumption in Appendix B.
2.3. Integration scheme and pair-up criterion
We began each simulation by selecting two stellar-mass BHs that were assumed to already be embedded in the AGN disk. For stellar-origin BHs, henceforth referred to as first generation (1g) BHs, masses m are sampled independently from a distribution obtained via population-synthesis modeling SEVN for solar metallicity (Iorio et al. 2023). The initial radial location Rinit, is drawn from a uniform distribution in logarithmic space. Specifically, the logarithm of the initial radius is uniformly sampled between the logarithm of the disk’s inner radius, assumed to be at the innermost stable circular orbit, Rmin = 6 Rg in this context, and an outer radius Rmax = 0.1 pc (M•/106 M⊙)1/2, beyond which the disk’s self-gravity becomes important (Goodman 2003; Yang et al. 2019b). This choice reflects the expectation that BHs can form or become embedded at various locations throughout the AGN disk, and provides a neutral baseline that does not bias our results toward any particular radial scale. However, the stellar-origin BHs we expect to find in an AGN disk come from the surrounding NSC, and the probability that they are captured by the disk depends on the properties of both the AGN disk and the NSC. As a result, embedded BHs are expected to accumulate preferentially in particular radial ranges, enhancing the probability of binary formation at those locations relative to our log-uniform assumption.
The subsequent orbital evolution is treated in one dimension, considering only the radial location as a function of time. The equation of motion is derived from angular momentum conservation in a Keplerian potential and takes the form:
 (16)
(16)
where Γ(R) is obtained as in Eq. (1) or (15) depending on whether the conditions for Type II migration (Eq. 13) are met. The torque profile is precomputed from the AGN disk model and interpolated at each timestep to reflect the actual mass and location of the migrating body.
We solved this system of coupled differential equations using the second-order Runge–Kutta integration method with embedded third-order error estimation and an adaptive timestep. The integration spans the full duration of the AGN disk’s activity, which we fix at 2 Myr, and is initialized with a timestep of 103 yr. To capture statistical trends in binary formation, this procedure was repeated for a large number of random initial conditions. We simulated 106 independent realizations, each with different initial masses and orbital radii, resulting in a comprehensive catalog of pair-up events across a wide range of physical parameters.
A central goal of the simulation is to determine whether and when a given pair of migrating single BHs becomes a bound binary. To that end, we randomly select two BHs in our catalog and we label them as primary (mass m1, radial location R1) and secondary (m2, R2), with the convention that m1 ≥ m2. We applied two complementary criteria for binary formation in post-processing, after completing the orbital integration of each single BH.
The first and most stringent condition is based on Hill stability (Hill 1878). We computed the instantaneous separation between the two BHs, d = |R1 − R2|, at each integration step and compare it to their Hill radii. A binary is considered to have formed if the separation falls below the larger of the two Hill radii, hence the two BHs are close enough for their mutual gravitational attraction to overcome tidal forces from the central SMBH:
 (17)
(17)
To prevent the integrator from skipping over close encounters due to large timesteps or rapid migration, we also monitored the sign of the radial separation Ecross = R1 − R2. A sign change in Ecross indicates that the BHs have crossed each other’s orbits and may have come into sufficiently close proximity to allow for capture. If either the explicit Hill condition or this indirect orbit-crossing condition is met, a BBH is considered to have formed.
In either case, we recorded the BBH formation time and its pair-up radius, defined as the mass-weighted average position of the two BHs at the moment of binary formation:
 (18)
(18)
This dual-criterion strategy balances accuracy and robustness, ensuring that bound systems are identified even when the BHs migrate rapidly or interact near the resolution limit of the integrator. However, it neglects the exact binary binding mechanism under the influence of gas torques and disk turbulence, investigated in hydrodynamical simulations (e.g. Whitehead et al. 2024b). The resulting catalog of binary formation events provides the foundation for our statistical analysis of BBH assembly in AGN disks.
2.4. Nth-generation BHs
For Nth-generation (Ng) BHs, which are the remnants of earlier mergers in the AGN disk, we estimated their orbital starting conditions using the outputs of 1g simulations. Hence, in the Ng simulations, the initial position Rinit of the primary BH is no longer drawn randomly across the disk. Instead, it is sampled directly from the set of Rpair values obtained in the 1g simulation, accounting for the natal velocity kick vkick that is imparted during the merger event. The recoil velocity vkick is drawn from a precomputed FASTCLUSTER catalog (Vaccaro et al. 2024) that already incorporates the dependence on progenitor mass ratio and spin configuration as in Maggiore (2018). The kick direction is randomized assuming isotropic ejection, and contributions from enclosed gas and NSC members are neglected given their small mass relative to the SMBH. If the kick magnitude exceeds the local escape velocity, the remnant is assumed to leave the system. Otherwise, the object is recaptured and is then able to migrate in the disk following the same torque prescriptions as 1g BHs. The shifted radius  is computed by means of simple orbital transfer calculations (Hohmann 1960) as
![Mathematical equation: $$ \begin{aligned} R_{\rm init}^\mathrm{new} = \frac{GM_\bullet }{v_{\rm tot}^2} \; \left[\frac{R_{\rm init}\,v_{\rm tot}^2/GM_\bullet }{2-R_{\rm init}\,v_{\rm tot}^2/GM_\bullet }\right], \end{aligned} $$](/articles/aa/full_html/2026/04/aa56761-25/aa56761-25-eq22.gif) (19)
(19)
where vtot is the vector sum of the circular orbital velocity  and the random kick vkick.
In doing so, we implicitly assumed that 1g binaries will eventually merge at a radial location not significantly different from where they originally paired up.
We only allowed Ng BHs to pair up with first-generation companions (forming Ng − 1g BBHs). This choice is motivated by the low probability of drawing a secondary of generation M, given the steeply decreasing p(M)∝2−(M − 1) (Zevin & Holz 2022). Accordingly, the secondary BH in each pair has mass and initial radial position sampled in the same way as in the 1g simulations.
This methodology ensures that Ng BHs are seeded in dynamically consistent locations, and allows us to model the spatial memory and redistribution of hierarchical mergers across the AGN disk. Other than the initial radius, the rest of the computation proceeds in an identical way to what previously described for 1g BHs.
2.5. Description of runs
We performed a suite of Monte Carlo simulations, running N = 105 realizations for each combination of model parameters. We explore how BBH formation in AGN disks depends on the mass of the central SMBH, the disk’s viscosity, and the underlying migration prescription.
We vary the SMBH mass over the range log M•/M⊙ = 5.0 − 9.0, encompassing typical values expected across cosmic time (e.g. Greene & Ho 2007; Trinca et al. 2022).
The disk viscosity for a SG disk, and more generally for so-called α-disk models, is parametrized by coefficient α ∈ [0, 1]. We adopt α = 0.1 and α = 0.4 to bracket the range suggested by observations of fully ionized accretion disks, which typically yield α ∼ 0.1 − 0.4 (King et al. 2005; Martin et al. 2019). We also ran some models with α = 0.01 in order to align with conventional assumptions in theoretical models that often presume lower turbulence efficiency (e.g. standard disk models such as SG) and magneto-hydrodynamical simulations (e.g. Hawley et al. 2011). We are limited by the assumption of a spatially constant α across the disk radius, consistent with the approximation in the SG model, despite more recent simulations indicating potential radial variation in viscosity (e.g. Penna et al. 2012).
To investigate the impact of different assumptions on the migration mechanism, we distinguished between a B16 prescription, where we set Γth = 0 in Eq. (1) and computed Γtype I as in Eq. (2) (as in Bellovary et al. 2016), and a G24 prescription where we set Γth as in Eq. (10) and Γtype I as in Eq. (7) (as in Grishin et al. 2024).
3. Results
3.1. Migration torques and pair-up radii
We begin by illustrating the torque structure that governs BH migration in SG disks. Figure 1 shows representative profiles of the total torque acting on a BH as a function of radial distance.
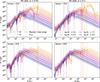 |
Fig. 1. Examples of torque profiles as a function of radial distance (in Schwarzschild radii) for BHs embedded in a SG disk. Each plot corresponds to a different combination of torque prescription (top: G24; bottom: B16), disk viscosity parameter α (left: α = 0.01; right: α = 0.1) and SMBH mass (log M•/M⊙ = 5.0, 6.3, 7.7, 9.0, represented in different colors). Solid and dashed lines indicate positive and negative net torques, respectively, while shaded regions denote uncertainty in the torque determined by computing it over a range of migrator masses between 5 M⊙ and 50 M⊙. Vertical dotted lines mark the locations of migration traps. |
The torque intensity and sign vary depending on the local properties of the disk such as temperature and density gradients as in Eqs. (2)–(9), which are themselves functions of α, R, and M•. The mass of the migrator m only affects the intensity of the torque via the normalization factor in Eq. (12). Hence, migration trap locations are disk-specific and independent on the characteristics of the migrating BHs. Multiple torque sign reversals from Γ > 0 to Γ < 0 are generally present, corresponding to migration traps, whose number and position are of course also sensitive to M• and α.
To connect this torque structure with the outcome of binary formation, we show in Figure 2 the full distribution of BBH pair-up locations across our catalog of simulations. Each panel displays a two-dimensional histogram in the radius–SMBH mass plane, indicating the logarithmic number of pair-ups in each bin. We also indicate the locations of migration traps, as extracted from the torque profiles. Most BHs that successfully form binaries do so while migrating under Type I migration, with fewer than 8% forming under Type II conditions.
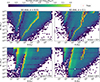 |
Fig. 2. Two-dimensional histograms showing the distribution of BBH pair-up locations in the radius–mass plane (R vs. M•), for different combinations of torque prescription (top: G24; bottom: B16) and disk viscosity α (left: 0.01; right: 0.1) in a SG disk. The color map indicates the number of pair-ups in each bin Npair. Red crosses mark the locations of migration traps. |
We find that the radial distribution of pair-ups is broadly consistent with the location of migration traps, supporting the idea that traps are favorable sites for binary formation. However, the distribution shows a significant spread around traps as well as some clear offsets, with efficient pair-ups also occurring at locations not identified as traps, while some traps contain no BBH pair-ups at all. These departures can be attributed to differential migration: mismatches in migration speed may cause pair of BHs to pair up upstream of the trap radius.
In some cases, such as at R ≃ 103 RS for M• < 106 M⊙ in the B16 prescription, there is a clear overdensity of pair-ups at locations which are not marked as traps, caused by sharp changes in the slope of Γ. We refer to these locations as traffic jams.
In systems with smaller SMBHs (log M•/M⊙ ≲ 6), pair-ups are possible at almost all radial locations in the disk, whereas at higher SMBH masses (log M•/M⊙ ≳ 7), the distribution of pair-up radii becomes significantly narrower and more concentrated toward the inner disk regions (102 ≲ R/RS ≲ 104). This narrowing reflects the increased gravitational influence of more massive SMBHs which dominates over local disk perturbations, leading to a more stable torque structure. In particular, the radial torque Γ at large radii is less intense and uniformly negative at high M•, reducing differential migration between BHs and suppressing their pairing in the outer disk region.
We observe relevant differences in the trap location based on the torque prescription, as shown in Figure 2. Using the full G24 migration torque gives rise to outer migration traps which are absent in the classical B16 case for SMBH masses log M•/M⊙ ∈ [5.6, ∼8.0] ([6.7, 9.0]) for α = 0.01 (0.1).
3.2. The relevance of migration traps
To quantify the role of migration traps in BBH formation, we track the radial locations at which BHs pair up and compare them to the positions of predefined migration traps in the disk. For each simulation, we identify a set of trap locations {Rtrap} based on the local torque profile, as described in Section 2.2. A pair-up event is considered to occur “within a trap” if the radial distance between the pair-up location Rpair and any trap satisfies the following logarithmic tolerance condition:
 (20)
(20)
where δ is a fixed tolerance. In this work, we adopt δ = 0.05.
Based on this definition, we compute the fraction ftrap as
 (21)
(21)
where Nin trap is the number of pair-up events satisfying the condition in Eq. (20), and Npair is the total number of pair-up events recorded in the simulation.
Figure 3 shows the resulting fraction ftrap, plotted as a function of the central SMBH mass. Overall, the majority of pair-ups occur within migration traps across most of the parameter space explored. For SMBH masses below a certain threshold  , ftrap has values of 0.7 to 0.9 for 1g BHs and it approaches unity for Ng BHs. As the SMBH mass increases, ftrap presents a pronounced transition from values close to unity to nearly zero, indicating that pair-up events are no longer connected with trap locations at high SMBH masses. This transition typically takes the form of an abrupt drop from ftrap ≃ 1 to ftrap ≃ 0, with specific value of
  depending on the disk and torque model adopted.
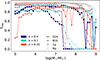 |
Fig. 3. Fraction of binary pair-ups occurring within migration traps as a function of the SMBH mass. The vertical axis shows the occurrence ftrap of pair-up events that take place in proximity to predefined migration trap locations, while the horizontal axis shows the logarithm of the central SMBH mass. Different marker fillings indicate the BH generation (filled: 1g; hollow: Ng), while color encodes the viscosity parameter α (orange: 0.01; teal: 0.1; navy blue: 0.4). The two torque formalisms are distinguished by marker shape and line style (squares and solid lines: G24; circles and dashed lines: B16). Trap proximity is defined using a logarithmic tolerance on radial separation (see Section 3.2 for details). |
In the high-viscosity B16 models (α = 0.1, 0.4), the drop occurs early, at  , whereas in the low-viscosity case (α = 0.01),
  . For the G24 model, the transition to low ftrap consistently occurs at large SMBH masses; specifically, at
  , > 109 M⊙, ≃108.5 M⊙ for the cases with α = 0.01, 0.1, 0.4. Furthermore, ftrap curves present some outliers due to peculiar disk properties for specific combinations of M• and α (see Figure 2 and additional |Γ| plots on Zenodo). For instance, in disks with log M•/M⊙ ∈ [5.0, 6.0] and α = 0.01, ftrap increases gradually from 0.2 to ∼0.8 for the B16 torque due to traffic jams: a sharp transition in the slope of Γ gives rise to many pair-up events outside of traps due to differential migration. Specifically, as visible in Figure 1, this happens at R ≲ 102 RS for log M•/M⊙ = 5.0 − 5.1 and at R ∼ 103 RS for log M•/M⊙ < 6.0.
We show normalized histograms of binary pair-up radii Rpair, split by BH generation (1g vs Ng), in Figure 4 for selected SMBH masses and disk viscosity. Pair-up locations for Ng BHs are considerably more concentrated around peaks than for 1g BHs. This enhanced localization arises from the initial conditions: in our model, Ng remnants resume migration at a radius set by Eq. (19). Because recoil speeds vkick are typically small relative to the local Keplerian velocity vKepl (Maggiore 2018; Vaccaro et al. 2024), the kick induces only a minor radial displacement, so Ng remnants remain close to the pair-up radius of their progenitor binary. Since 1g binaries preferentially form near peaks in the Rpair distribution, the ensuing Ng BHs tend to start their migration near those same radii. As a result, Rpair for Ng objects clusters tightly around peaks, which naturally explains the systematically higher values of ftrap seen for Ng in Figure 3 since most peaks are coincident with traps. In contrast, 1g BHs are initialized with randomly distributed radial positions within the disk, and their subsequent migration is governed entirely by the local torque profile. While traps still influence the dynamics, the broader range of initial conditions results in a more diffuse distribution of pair-up radii, and therefore a lower ftrap.
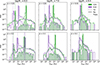 |
Fig. 4. Histograms of binary pair-up radii Rpair (in units of Schwarzschild radii) for first-generation (1g) and Nth-generation (Ng) BHs, across a range of SMBH masses (log M•/M⊙ = 6, 7, 8 in the three columns, respectively) and viscosity parameters (upper row: α = 0.01; lower row: α = 0.1). Panels show the pair-up radii probability density functions (PDFs), normalized separately in each panel. The 1g distributions are shown as step histograms, while Ng distributions are overlaid either as filled or hatched histograms for visual distinction. Vertical dotted lines indicate the positions of migration traps identified from the torque profile. Color represents the migration model used (green: G24; purple: B16). |
For low viscosity (α = 0.01) under the B16 prescription, we also find a pronounced pile-up of pair-ups at R ≃ 103 RS for M• ≲ 106 M⊙ that does not coincide with migration trap locations. This is a direct consequence of differential migration: as shown in Figure 1, the |Γ(R)| profiles exhibit an abrupt change in slope at these radii, producing a traffic-jam accumulation of pair-ups.
These findings emphasize the importance of migration traps as anchoring points for BBH formation in AGN disks. Their effectiveness is sensitive to both disk properties (through the viscosity parameter α) and central SMBH mass, and is particularly crucial for Ng pair-ups and their resulting hierarchical mergers.
3.3. Pair-up efficiency
We define the pair-up efficiency η as the fraction of BHs in a given simulation that successfully form a binary by the end of the AGN disk lifetime. That is,
 (22)
(22)
where Npair is the number of BHs that participated in a pair-up event, and Ntot is the total number of simulated BHs. Figure 5 shows the behavior of η as a function of the central SMBH mass, for both 1g and Ng BHs. As expected, the efficiency tends to decrease with increasing SMBH mass, due to the suppression of differential migration in the outer regions of the disk discussed in Section 3.1. Nonetheless, Ng BHs consistently exhibit higher pair-up efficiency than their 1g analogs. This is a consequence of their more favorable initial conditions as previously observed for ftrap: they typically start closer to trap or traffic-jam locations, which increases their likelihood of encountering a suitable companion before the end of the disk lifetime.
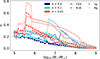 |
Fig. 5. Pair-up efficiency as a function of the central SMBH mass. The vertical axis shows the fraction of BHs that successfully form a binary during the simulation, while the horizontal axis shows the logarithm of the SMBH mass. As in Figure 3, different marker fillings indicate the BH generation (filled: 1g; hollow: Ng), color encodes the viscosity parameter α (orange: 0.01; teal: 0.1; navy blue: 0.4), and the two torque prescriptions are distinguished by marker shape and line style (squares and solid lines: G24; circles and dashed lines: B16). |
We also observe a systematic, although modest, dependence of η on the value of α and on the assumed migration model. For low-viscosity disks (α = 0.01), pair-up efficiency remains higher across a broader range of SMBH masses, whereas higher values of α (0.1, 0.4) slightly reduce the likelihood of BBH formation. Interestingly, these differences are more pronounced for the Ng BHs than for 1g, where the impact of α is comparatively marginal. This may be due to the inherently stochastic nature of pair-up dynamics in the outer disk regions at high viscosity (α ≥ 0.1), relatively low SMBH masses (log M•/M⊙ ≲ 6.5), where multiple nearby trap locations (noticeable in Figures 1 and 2) can lead to complex migration patterns.
We also note marked jumps in η which correlate with the temporary disappearance of outer migration traps in the corresponding M• range, which allows outer BHs to move toward intermediate-radius (∼103 RS) locations, characterized by sudden changes in the slope of Γ which facilitate BBH captures by differential migration. This happens most notably at log M•/M⊙ ∼ 5.6 − 5.8 for α = 0.01, and at log M•/M⊙ ≳ 6.7 for α = 0.1.
3.4. Impact of initial conditions
Figure 6 is an analysis of how the pair-up efficiency η and the trap fraction ftrap depend on the initial conditions of the migrating BH, specifically its initial radial position Rinit and mass m.
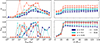 |
Fig. 6. Pair-up efficiency (top panels) and fraction of pair-ups occurring within migration traps (bottom panels) as functions of initial radius Rinit (left) and migrator mass m (right). Color encodes the viscosity parameter α (orange: 0.01; teal: 0.1; navy blue: 0.4), and the two torque prescriptions are distinguished by marker shape and line style (squares and solid lines: G24; circles and dashed lines: B16). |
The pair-up efficiency η shows a strong radial dependence, peaking at intermediate radii (Rinit ∼ 102 − 105 RS). This trend reflects the underlying structure of the torque profile: migration is inefficient near the inner and outer edges of the disk, while the central regions allow for efficient dynamical pairing. In the innermost disk, pair-ups are suppressed by limited radial volume and weaker torques, whereas in the outer disk, BHs typically migrate too slowly to encounter a companion within the AGN lifetime. A secondary dependence on mass is also evident: heavier BHs (m ≳ 20 M⊙) tend to achieve higher pair-up efficiencies due to their stronger interaction with the gas and faster migration rates.
The trap fraction ftrap follows a similar, but more pronounced, trend to the pair-up efficiency η in terms of BH mass m. In particular, stellar-mass BHs with m ≲ 20 M⊙ are generally unable to reach migration traps, with average ftrap remaining below 0.3, whereas BHs with m ≳ 20 M⊙ consistently exhibit trap fractions exceeding 0.6 (0.9) in the B16 (G24), indicating that higher-mass objects are not only more efficient migrators but also more likely to pair up in the vicinity of traps.
However, the dependence of ftrap on the initial radius Rinit appears more complex than that of the overall efficiency η. While the peak values of both quantities occur broadly in the same intermediate radial range (∼102 − 105 RS), the trap fraction displays sharper and more localized peaks. This suggests that proximity to a trap at birth plays a significant role: BHs that happen to become embedded sufficiently close to a stable trap are more likely to remain in its vicinity and undergo in-trap pair-up. Consequently, ftrap is subject to a degree of stochasticity tied to the initial orbital configuration, which is less evident in the smoother behavior of η.
3.5. Migration timescales
In semi-analytical models of BH dynamics in AGN disks, the migration timescale is often estimated using the rate of angular momentum change via gaseous torques. A common approximation (e.g. McKernan et al. 2012; Vaccaro et al. 2024) is to compute the migration time as the ratio between the angular momentum L of the BH and the torque normalization Γ0:
 (23)
(23)
where L = mR2Ω and Γ0 is as in Eq. (12). This simplified expression is widely used in the literature as it captures the characteristic timescale over which a BH would drift through the disk under idealized conditions. In Figure 7, the resulting timescales computed for a 10 M⊙ BH are shown as dashed lines for different SMBH masses, viscosity parameters, and torque prescriptions.
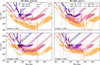 |
Fig. 7. Two-dimensional distributions of the migration time tmigr as a function of the initial radius Rinit in SG AGN disks, for different combinations of the viscosity parameter α (left: 0.01; right: 0.1) and torque prescriptions (top: G24; bottom: B16). Each panel shows contours enclosing 40% and 68% of the migration time distribution, based on our simulations. Results are shown for four representative SMBH masses: log(M•/M⊙) = 5.0, 6.3, 7.7, 9.0, indicated by color. Solid (dashed) lines represent the migration timescale computed using the torque Γ in Eq. (1) (Γ0 in Eq. 12). Vertical dotted lines mark the locations of migration traps. |
However, when using the full torque Γ (Eq. 1) the corresponding migration timescale, tmigr = L/Γ, deviates from the Γ0-based estimate, especially in regions near torque sign-reversal points, i.e., in the vicinity of migration traps or anti-traps, where Γ = 0. As a result, the solid lines in Figure 7 exhibit sharp features and even divergences, reflecting the breakdown of the timescale approximation in those zones.
To assess how well either of these approximations tracks the actual dynamical evolution of BHs in the disk, we compare them to the pair-up times, tpair, obtained directly from our simulations. These pair-up times, shown via the 40% and 68% contour levels in Figure 7, represent the elapsed time between the moment at which the single primary BH becomes embedded in the disk and the subsequent formation of a BBH. Unlike tmigr, they are measured durations rather than derived timescales, and naturally include the effects of stochasticity, mass differences, and local disk structure. Several important features emerge from this comparison. There is substantial scatter in the pair-up times at fixed radius, due in part to the variation in the mass of the migrating BH. There is a sharp upper limit at tmigr = 2 Myr, corresponding to the assumed AGN disk lifetime adopted in our model. Moreover, some radial regions are systematically disfavored for binary formation, as also noticeable in Figure 6, due to either negative torques in the innermost regions of the disk or to reduced differential migration in the outer disk regions for large M•, as discussed in Section 3.1. Finally, pair-up times in our simulations are typically shorter than the estimated migration timescale in regions where the Γ profile has a large slope, and longer where the profile is flatter. This is a consequence of differential migration: pair-ups are set by relative drift rather than absolute torque. Where the migration speed profile is steep, nearby objects converge quickly and pair up fast. Vice versa, where the profile is flat, velocity differences are only mass-dependent and consequently pair-up times lengthen.
4. Caveats
Our current approach still presents several limitations.
First, we do not model gas accretion onto individual BHs. Accretion is expected to lead to spin alignment and mass growth, which in turn influences migration rates and pair-up probabilities. We also neglect any vertical stratification in the AGN disk and restrict all BHs to move strictly in the midplane, thereby omitting any effect related to vertical motion. In addition, the SG model is not fully realistic, as it assumes an unspecified heating source and does not account for gas consumption even in gravitationally unstable regions.
Our treatment of Type II migration is deliberately conservative, as gap-opening objects are assumed to effectively prevent any inflow across the gap. More realistically, the transition to Type II is not a hard switch: the gap would not open fully and gas inflow would not be completely suppressed (Malik et al. 2015). As a result, the Type II regime would more closely resemble a modified Type I migration with reduced local density (as shown in Kanagawa et al. 2018; Fung et al. 2014). We explore this alternative model for Type II migration in Appendix B.
Moreover, our model does not include resonant interactions, such as mean-motion resonances, which could alter or halt migration (Epstein-Martin et al. 2025; Moncrieff et al. 2026). We also do not consider dynamical formation via three-body scatterings, which is another viable mechanism of BBH formation in AGN environments (Tagawa et al. 2020b). Finally, while our pair-up criterion identifies candidate binaries based on proximity, it does not explicitly model binary binding or survivability under the influence of gas torques and disk turbulence.
We will cure these approximations in a forthcoming study.
5. Summary
Semi-analytical models such as FASTCLUSTER (Mapelli et al. 2021, 2022; Vaccaro et al. 2024; Torniamenti et al. 2024) and MCFACTS (McKernan et al. 2025; Cook et al. 2025; Delfavero et al. 2025) have proven to be useful tools for modeling hierarchical mergers of BHs in AGN disks. Their computational efficiency allows for rapid exploration of the parameter space and facilitates comparisons with observational data. However, these models often rely on simplified assumptions regarding the locations at which BBHs form. A common assumption, made for example by Vaccaro et al. (2024), is that all pair-ups occur at so-called migration traps. While this assumption captures part of the physical picture, it overlooks the diversity of pair-up locations that can arise from realistic differential migration.
In this work, we have achieved a more realistic distribution of pair-up radii via explicit integration of migration torques computed for self-consistent SG AGN disk models modeled with the software pAGN (Gangardt et al. 2024). We identify migration traps as any location in the disk where the torque changes sign from positive to negative. Our key findings are as follows:
-
The radial distribution of BBH pair-ups mainly follows the locations of migration traps, but with some spread and offsets due to differential migration. The overall pair-up radii profile is mostly influenced by the mass of the SMBH M•, specifically: (i) For log M•/M⊙ ≲ 6.5, BBH pair-ups occur broadly across the entire disk; (ii) for log M•/M⊙ ≳ 6.5, pair-ups concentrate in the inner disk (102 ≲ R/RS ≲ 104).
-
The efficiency of BBH formation η is mildly influenced by the disk parameters, decreasing for increasing M• and α, and it it mostly influenced by the initial conditions of the migrating BHs. Indeed, BBHs are formed more efficiently for intermediate initial radii (Rinit ∼ 102 − 105 RS) and large migrator mass (m ≳ 20 M⊙).
-
A large fraction of BBH pair-ups (ftrap ≳ 80% for first-generation BHs, ftrap ∼ 100% for N-th generation BHs) occur in migration traps for low-to-intermediate SMBH masses
 . The threshold value is model dependent:
  for the high-viscosity (α ≥ 0.1) in the B16 case, or
  for all other models. At larger SMBH masses, ftrap drops to lower values.
 -
For low SMBH masses (log M•/M⊙ < 6.0), low viscosity (α = 0.01) and B16 torque prescriptions, pair-up events pronouncedly pile up at R ≃ 103 RS as consequence of differential migration: sharp changes in the slope of |Γ(R)| create a traffic-jam accumulation even in the absence of a trap.
-
Estimating migration timescales as the inverse of the rate of angular momentum change (
 ) tends to overestimate pair-up times in outer disk regions. True pair-up times (from simulations) are shorter due to differential migration and movement into regions of stronger torque.
Our results demonstrate that, although BBH formation predominantly happens in migration traps for a large portion of the explored parameter space, formation in the bulk is non-negligible.
By integrating the migration trajectories of individual BHs and applying physically motivated pair-up criteria, we recover a distribution of pair-up radii that reflects the full complexity of orbital evolution in AGN disks. This highlights the limitations of using predetermined locations to represent the entire BBH formation process.
Incorporating realistic pair-up radius distributions into semi-analytic population models will improve the physical accuracy of merger rate predictions. It allows for a more sensible representation of where and when binaries are likely to form, and it captures the contribution of dynamically overtaking encounters which is entirely missed when assuming a static trap location.
Data availability
Supplementary material, data, and code used in this study are available via Zenodo at this link.
Acknowledgments
We thank the anonymous referee for their constructive and insightful comments that improved this manuscript. We thank Kees Dullemond, Dominika Wylezalek, Ralf Klessen, Evgeni Grishin, Nick Stone, Alessandro A. Trani, K.E. Saavik Ford, Barry McKernan, Shawn Ray, Thomas Rometsch, Zoltan Haiman, Shmuel Gilbaum, and Lumen Boco for useful discussions. MPV and MM acknowledge financial support from the European Research Council for the ERC Consolidator grant DEMOBLACK, under contract no. 770017. They also acknowledge financial support from the German Excellence Strategy via the Heidelberg Cluster of Excellence (EXC 2181 – 390900948) STRUCTURES. The authors acknowledge support by the state of Baden-Württemberg through bwHPC and the German Research Foundation (DFG) through grants INST 35/1597-1 FUGG and INST 35/1503-1 FUGG. The public version of FASTCLUSTER is available via gitlab following this link. We thank Daria Gangardt for developing the pAGN software, which is publicly available via github following this link. This research made use of NUMPY (Harris et al. 2020), SCIPY (Virtanen et al. 2020), PANDAS (The pandas development Team 2024). Plots were produced using MATPLOTLIB (Hunter 2007).
References
- Abbott, R., Abbott, T. D., Acernese, F., et al. 2023a, Phys. Rev. X, 13, 041039 [Google Scholar]
- Abbott, R., Abbott, T. D., Acernese, F., et al. 2023b, Phys. Rev. X, 13, 011048 [NASA ADS] [Google Scholar]
- Bartos, I., Kocsis, B., Haiman, Z., & Márka, S. 2017, ApJ, 835, 165 [Google Scholar]
- Bellovary, J. M., Low, M. M., McKernan, B., & Saavik Ford, K. E. 2016, ApJ, 819, L17 [NASA ADS] [CrossRef] [Google Scholar]
- Bryden, G., Chen, X., Lin, D. N. C., Nelson, R. P., & Papaloizou, J. C. B. 1999, ApJ, 514, 344 [CrossRef] [Google Scholar]
- Cook, H. E., McKernan, B., Ford, K. E. S., et al. 2025, ApJ, 993, 163 [Google Scholar]
- Crida, A., Morbidelli, A., & Masset, F. 2006, Icarus, 181, 587 [Google Scholar]
- DeLaurentiis, S., Epstein-Martin, M., & Haiman, Z. 2023, MNRAS, 523, 1126 [NASA ADS] [CrossRef] [Google Scholar]
- Delfavero, V., Ford, K. E. S., McKernan, B., et al. 2025, ApJ, 989, 67 [Google Scholar]
- Dittmann, A. J., Dempsey, A. M., & Li, H. 2025, ApJ, 990, 137 [Google Scholar]
- Duffell, P. C. 2015, ApJ, 807, L11 [CrossRef] [Google Scholar]
- Epstein-Martin, M., Stone, N., & Becker, J. 2025, ArXiv e-prints [arXiv:2510.12895] [Google Scholar]
- Fung, J., Shi, J.-M., & Chiang, E. 2014, ApJ, 782, 88 [NASA ADS] [CrossRef] [Google Scholar]
- Gangardt, D., Trani, A. A., Bonnerot, C., & Gerosa, D. 2024, MNRAS, 530, 3689 [Google Scholar]
- Gilbaum, S., Grishin, E., Stone, N. C., & Mandel, I. 2025, ApJ, 982, L13 [Google Scholar]
- Goodman, J. 2003, MNRAS, 339, 937 [NASA ADS] [CrossRef] [Google Scholar]
- Greene, J. E., & Ho, L. C. 2007, ApJ, 667, 131 [NASA ADS] [CrossRef] [Google Scholar]
- Grishin, E., Gilbaum, S., & Stone, N. C. 2024, MNRAS, 530, 2114 [NASA ADS] [CrossRef] [Google Scholar]
- Harris, C. R., Millman, K. J., van der Walt, S. J., et al. 2020, Nature, 585, 357 [NASA ADS] [CrossRef] [Google Scholar]
- Hawley, J. F., Guan, X., & Krolik, J. H. 2011, ApJ, 738, 84 [NASA ADS] [CrossRef] [Google Scholar]
- Hill, G. W. 1878, Am. J. Math., 1, 5 [Google Scholar]
- Hohmann, W. 1960, The Attainability of Heavenly Bodies, NASA Technical Translation (National Aeronautics and Space Administration) [Google Scholar]
- Hunter, J. D. 2007, Comput. Sci. Eng., 9, 90 [NASA ADS] [CrossRef] [Google Scholar]
- Iorio, G., Mapelli, M., Costa, G., et al. 2023, MNRAS, 524, 426 [NASA ADS] [CrossRef] [Google Scholar]
- Ishibashi, W., & Gröbner, M. 2020, A&A, 639, A108 [NASA ADS] [CrossRef] [EDP Sciences] [Google Scholar]
- Ishibashi, W., & Gröbner, M. 2024, MNRAS, 529, 883 [Google Scholar]
- Jiménez, M. A., & Masset, F. S. 2017, MNRAS, 471, 4917 [Google Scholar]
- Kanagawa, K. D., Tanaka, H., & Szuszkiewicz, E. 2018, ApJ, 861, 140 [Google Scholar]
- King, A. R., Lubow, S. H., Ogilvie, G. I., & Pringle, J. E. 2005, MNRAS, 363, 49 [NASA ADS] [CrossRef] [Google Scholar]
- Kley, W., & Nelson, R. P. 2012, ARA&A, 50, 211 [Google Scholar]
- Kocsis, B., Yunes, N., & Loeb, A. 2011, Phys. Rev. D, 84, 024032 [NASA ADS] [CrossRef] [Google Scholar]
- Li, J., Dempsey, A. M., Li, H., Lai, D., & Li, S. 2023, ApJ, 944, L42 [NASA ADS] [CrossRef] [Google Scholar]
- Lin, D. N. C., & Papaloizou, J. C. B. 1993, Protostars and Planets III (Tucson: University of Arizona Press), 749 [Google Scholar]
- Lyra, W., Paardekooper, S.-J., & Low, M.-M. M. 2010, ApJ, 715, L68 [NASA ADS] [CrossRef] [Google Scholar]
- Maggiore, M. 2018, Gravitational Waves: Volume 2: Astrophysics and Cosmology, Gravitational Waves (Oxford University Press) [Google Scholar]
- Malik, M., Meru, F., Mayer, L., & Meyer, M. 2015, ApJ, 802, 56 [NASA ADS] [CrossRef] [Google Scholar]
- Mapelli, M., Dall’Amico, M., Bouffanais, Y., et al. 2021, MNRAS, 505, 339 [CrossRef] [Google Scholar]
- Mapelli, M., Bouffanais, Y., Santoliquido, F., Arca Sedda, M., & Artale, M. C. 2022, MNRAS, 511, 5797 [NASA ADS] [CrossRef] [Google Scholar]
- Martin, R. G., Nixon, C. J., Pringle, J. E., & Livio, M. 2019, New Astron., 70, 7 [Google Scholar]
- Masset, F. S. 2017, MNRAS, 472, 4204 [NASA ADS] [CrossRef] [Google Scholar]
- McKernan, B., Ford, K. E. S., Lyra, W., & Perets, H. B. 2012, MNRAS, 425, 460 [NASA ADS] [CrossRef] [Google Scholar]
- McKernan, B., Ford, K. E. S., Kocsis, B., Lyra, W., & Winter, L. M. 2014, MNRAS, 441, 900 [NASA ADS] [CrossRef] [Google Scholar]
- McKernan, B., Ford, K. E. S., O’Shaugnessy, R., & Wysocki, D. 2020, MNRAS, 494, 1203 [NASA ADS] [CrossRef] [Google Scholar]
- McKernan, B., Ford, K. E. S., Cook, H. E., et al. 2025, ApJ, 990, 217 [Google Scholar]
- Moncrieff, J. W. N., Grishin, E., Trani, A. A., Panther, F. H., & Pietrosanti, O. 2026, MNRAS, 545, staf2217 [Google Scholar]
- Paardekooper, S. J., Baruteau, C., Crida, A., & Kley, W. 2010, MNRAS, 401, 1950 [NASA ADS] [CrossRef] [Google Scholar]
- Penna, R. F., Sądowski, A., Kulkarni, A. K., & Narayan, R. 2012, MNRAS, 428, 2255 [Google Scholar]
- Peters, P. C. 1964, Phys. Rev., 136, 1224 [Google Scholar]
- Petrovich, C., & Rafikov, R. R. 2012, ApJ, 758, 33 [Google Scholar]
- Rowan, C., Boekholt, T., Kocsis, B., & Haiman, Z. 2023, MNRAS, 524, 2770 [NASA ADS] [CrossRef] [Google Scholar]
- Rowan, C., Whitehead, H., Boekholt, T., Kocsis, B., & Haiman, Z. 2024, MNRAS, 527, 10448 [Google Scholar]
- Rowan, C., Whitehead, H., Fabj, G., et al. 2025a, MNRAS, 543, 132 [Google Scholar]
- Rowan, C., Whitehead, H., Fabj, G., et al. 2025b, MNRAS, 539, 1501 [Google Scholar]
- Rozner, M., & Perets, H. B. 2024, ApJ, 968, 80 [NASA ADS] [CrossRef] [Google Scholar]
- Rozner, M., Generozov, A., & Perets, H. B. 2023, MNRAS, 521, 866 [Google Scholar]
- Samsing, J., Bartos, I., D’Orazio, D. J., et al. 2022, Nature, 603, 237 [NASA ADS] [CrossRef] [Google Scholar]
- Secunda, A., Bellovary, J., Mac Low, M.-M., et al. 2020, ApJ, 903, 133 [NASA ADS] [CrossRef] [Google Scholar]
- Shakura, N. I., & Sunyaev, R. A. 1973, A&A, 24, 337 [NASA ADS] [Google Scholar]
- Sirko, E., & Goodman, J. 2003, MNRAS, 341, 501 [NASA ADS] [CrossRef] [Google Scholar]
- Stone, N. C., Metzger, B. D., & Haiman, Z. 2017, MNRAS, 464, 946 [Google Scholar]
- Tagawa, H., Haiman, Z., Bartos, I., & Kocsis, B. 2020a, ApJ, 899, 26 [Google Scholar]
- Tagawa, H., Haiman, Z., & Kocsis, B. 2020b, ApJ, 898, 25 [NASA ADS] [CrossRef] [Google Scholar]
- Tagawa, H., Kimura, S. S., Haiman, Z., Perna, R., & Bartos, I. 2023, ApJ, 950, 13 [NASA ADS] [CrossRef] [Google Scholar]
- The pandas development Team 2024, https://doi.org/10.5281/zenodo.10697587 [Google Scholar]
- Tiede, C., Zrake, J., MacFadyen, A., & Haiman, Z. 2020, ApJ, 900, 43 [NASA ADS] [CrossRef] [Google Scholar]
- Torniamenti, S., Mapelli, M., Périgois, C., et al. 2024, A&A, 688, A148 [NASA ADS] [CrossRef] [EDP Sciences] [Google Scholar]
- Trinca, A., Schneider, R., Valiante, R., et al. 2022, MNRAS, 511, 616 [NASA ADS] [CrossRef] [Google Scholar]
- Vaccaro, M. P., Mapelli, M., Périgois, C., et al. 2024, A&A, 685, A51 [NASA ADS] [CrossRef] [EDP Sciences] [Google Scholar]
- Velasco Romero, D. A., & Masset, F. S. 2020, MNRAS, 495, 2063 [Google Scholar]
- Virtanen, P., Gommers, R., Oliphant, T. E., et al. 2020, Nat. Meth., 17, 261 [Google Scholar]
- Wang, Y.-H., McKernan, B., Ford, S., et al. 2021, ApJ, 923, L23 [NASA ADS] [CrossRef] [Google Scholar]
- Wang, Y., Zhu, Z., & Lin, D. N. C. 2024, MNRAS, 528, 4958 [NASA ADS] [CrossRef] [Google Scholar]
- Whitehead, H., Rowan, C., Boekholt, T., & Kocsis, B. 2024a, MNRAS, 533, 1766 [Google Scholar]
- Whitehead, H., Rowan, C., Boekholt, T., & Kocsis, B. 2024b, MNRAS, 531, 4656 [Google Scholar]
- Whitehead, H., Rowan, C., & Kocsis, B. 2025, MNRAS, 543, 3768 [Google Scholar]
- Xue, L., Tagawa, H., Haiman, Z., & Bartos, I. 2025, Phys. Rev. D, 112, 063034 [Google Scholar]
- Yang, Y., Bartos, I., Gayathri, V., et al. 2019a, Phys. Rev. Lett., 123, 181101 [CrossRef] [Google Scholar]
- Yang, Y., Bartos, I., Haiman, Z., et al. 2019b, ApJ, 876, 122 [NASA ADS] [CrossRef] [Google Scholar]
- Zevin, M., & Holz, D. E. 2022, ApJ, 935, L20 [CrossRef] [Google Scholar]
Here cV is the thermodynamic constant with constant volume, Ω is the Keplerian angular velocity, τeff is the effective optical depth, and σ is the Stefan-Boltzmann constant.
Appendix A: Improved disk modeling and comparison to previous work
A proper and realistic description of the properties of AGN disks is crucial for modeling compact object dynamics in such environments. In this work, we model AGN disks using the analytical tool pAGN, developed by Gangardt et al. (2024), to numerically solve Sirko & Goodman (2003, SG) equations of disk structure. A similar approach has recently been adopted in most semi-analytical models for the AGN channel (e.g. Vaccaro et al. 2024; Cook et al. 2025; Delfavero et al. 2025). This provides smooth profiles for key quantities for any combination of system parameters in a manner fully consistent with the physical description of SG. The resulting profiles for selected SMBH masses M• are shown in Figure A.1 and Figure A.2 (hereafter A.1 and A.1) for high (α = 0.1) and low (α = 0.01) viscosity respectively.
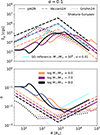 |
Fig. A.1. Radial profiles of surface density Σg (top panel) and aspect ratio h = H/R (bottom panel) of α = 0.1 disks, under different numerical treatments. The thin cyan line shows the original SG profile as published in Sirko & Goodman 2003, valid only for log M•/M⊙ = 8.0 and α = 0.01. Thicker colorful lines are extensions of the model to different SMBH masses (orange: log M•/M⊙ = 6.0; purple: 7.0; black: 8.0). Different line-styles distinguish the numerical method: solid lines are self-consistent solutions of the SG equations computed with pAGN, while dashed and dotted lines represent power-law scaling approximations from Vaccaro et al. (2024) and Grishin et al. (2024) respectively. The dot-dashed gray line is a Shakura & Sunyaev (1973) disk for comparison. Solid lines should be regarded as the most physically consistent profiles within this framework. |
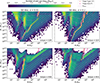 |
Fig. A.3. Two-dimensional histograms showing the distribution of BBH pair-up locations in the K18 model in the radius–mass plane (R vs M•), for different combinations of torque prescription (top: G24; bottom: B16) and disk viscosity α (left: 0.01; right: 0.1), for a SG disk model. The color map indicates the number of pair-ups in each bin, Npair. Pink dots mark the locations of migration traps in the K18 model, while red crosses mark the Type I trap positions (as in Figure 2). Pink contours show the values of the normalized contrast parameter Knorm. |
In this appendix, we compare our current prescription with models of α-disks previously used in the literature. An α-disk is a model in which gas turbulence is assumed to be the cause of disk viscosity, characterized by the viscosity coefficient α ∈ [0, 1]. The prototypical α-disk is the one by Shakura & Sunyaev (1973), where crucial quantities such as the gas surface density Σg and aspect ratio h are modeled as power laws. We show the resulting profile in A.1 and A.1, using the Kocsis et al. (2011, eqs. 32–33) treatment and assuming  . The obvious problem with this disk model is that becomes unphysical in the outer regions, and it is hence only valid for R ≲ 103RS. Moreover, such disks are viscously, thermally, and convectively unstable to perturbations, meaning that they can easily fragment into smaller sub-clouds (Kocsis et al. 2011).
Sirko & Goodman (2003) extend the Shakura & Sunyaev (1973) model by assuming that star formation in the outskirts of the disk acts as stabilizing mechanism against fragmentation. Moreover, the SG model is also broadly consistent with observed quasar spectral energy distributions, as it more accurately reproduces the flat UV–optical slopes and IR excesses characteristic of luminous quasars. he full model consists of 16 coupled equations describing the radial structure of the disk, which were originally solved self-consistently for a fiducial set of parameters: log M•/M⊙ = 8.0, α = 0.01, and  . Before the publication of the pAGN tool, various approximations were required to generalize this solution to other physical regimes. In the following, we illustrate two examples.
In Vaccaro et al. (2024, eqs. 1–2), we fit the original profile with broken power laws, and combine it with a first-order rescaling in M• and α. As shown in A.1 and A.1, this provides quite a crude modeling of the relevant quantities, as it neglects the complex interdependency between parameters in the full system of equations. The approximation breaks down most noticeably at high α and high M•, where it severely overestimates the surface density Σg in the inner regions of the disk.
Another approach is the one by Grishin et al. (2024, eqs. 3–11) who reengineer an analytical model which is similar in spirit to SG, but neglecting some of the physics and using simplified analytical expressions. The resulting profiles, also shown in A.1 and A.1 for  , are qualitatively similar to the SG ones computed with pAGN (meaning that they feature an inner region where the density increases and the thickness decreases for growing radii, and an outer region where the opposite happens), but the transition radii are systematically one order of magnitude smaller than in the more accurate SG paradigm. Moreover, they also overestimate the density and underestimate the aspect ratio in the inner regions (R ≲ 103RS).
This highlights the importance of solving the full set of equations with pAGN, as the dependence of the disk structure on α and M• is highly nonlinear and cannot be captured by simple rescaling or analytical fits, when constructing models of BH dynamics in AGN disks.
Appendix B: Type II migration
The classical picture of Type II migration assumes that, once a gap is opened, the embedded object becomes locked to the viscous inflow of the disk with migration timescale ttype II = tvisc, as assumed in subsection 2.2. This disk-dominated view is conservative: it assumes the gap to be completely cleared and gas inflow across the gap to be suppressed. Recent hydrodynamical simulations have shown that this picture is oversimplified: in reality, gap opening is often partial and gas can leak through the gap edges, leading to migration rates that are faster than the purely viscous timescale (e.g. Malik et al. 2015).
Kanagawa et al. (2018) (hereafter K18) proposed a modified prescription that interpolates between Type I and Type II regimes, so that migration is well described as a modified Type I regime with reduced local density
 (B.1)
(B.1)
where the contrast parameter K is defined as in eq. 13. For low-mass migrators (K ≲ 1, Σg′≳0.96 Σg), the gap is shallow and standard Type I migration (eq. 1) remains valid. As the migrator mass increases, the contrast parameter K grows quadratically. The full transition to a Type II regime happens for K ≳ 20 (K18), as the disk surface density at the orbit is significantly reduced to Σg′≲0.55 Σg.
We calculate corotational gas torques in eqs. 3, 4, 5, 6, 7, and 12 using the reduced local density Σg′. In this regime, both the normalization of the torque Γ0 (eq. 12), and the shape of the torque profiles (via the parameter a in eq. 4) are significantly modified. We include an exponential decay term which scales with the contrast factor K, as in K18. We leave the Lindblad torque (ΓL, eq. 8) unperturbed.
The effect of gap opening of Lindblad torques is quite complex, as it depends on the exact profile of the gap (e.g. Kley & Nelson 2012; Petrovich & Rafikov 2012). A more comprehensive simulation would include modeling the gap’s density profile and computing Lindblad torques self-consistently. However, in the high-viscosity regime in which we are operating, we do not expect any nonlinear behavior that would strongly affect our results (Duffell 2015).
Explicitly, our torque equations read
![Mathematical equation: $$ \begin{aligned} \Gamma \prime = \left[\left(\frac{0.46 - 0.96 a\prime + 1.8 b}{\gamma }\right) \, \Gamma \prime _0 + \Gamma \prime _{\rm th}\right] e^{-K/20} + \Gamma _{\rm L} \end{aligned} $$](/articles/aa/full_html/2026/04/aa56761-25/aa56761-25-eq41.gif) (B.2)
(B.2)
in the G24 case and
 (B.3)
(B.3)
in the B16 case, where Γ′i = Γi(Σg′) and a′= − ∂log Σ′g/∂log R.
An important implication is that migration traps are no longer determined solely by the background disk structure, as the torques Γ′=Γ(Σg′) are now K-dependent and, consequently, m-dependent. This mass dependence adds an additional layer of complexity to the dynamics of BHs in AGN disks. In the following, the trap locations under the K18 prescription are defined as the radii where the total migration torque Γ′ acting on a migrator of average mass (m ≃ 13.5 M⊙) changes sign from positive to negative.
While the gap contrast naturally depends on the properties of the migrator, a disk-specific contrast parameter Knorm can be defined by normalizing over the migrator mass:
 (B.4)
(B.4)
We recompute the binary formation catalog using the K18 prescription for gap opening. The resulting pair-up distributions are shown in Figure A.3. Compared to the results presented in subsection 3, the locations of migration traps differ substantially for low-mass SMBHs (M• ≲ 107 M⊙), because the modified torques tend to shift the zero-torque radii away from regions of high contrast Knorm.
In the G24 scenario, the peaks in the pair-up radius distributions are generally located in proximity to the new migration traps, with the exception of systems with M• ≲ 106 M⊙ which present traffic-jam accumulations of pair-up events in regions of low contrast (Knorm ≲ 1), even in the absence of traps.
In the B16 framework, the Lindblad torque is neglected (see eqs. 2 and B.3). Hence, the migration torque is highly suppressed in areas of high contrast (Knorm ≳ 1) and almost no pair-up events happen at radii R ∈ [102, 105]Rg for M• ≤ 105.8 M⊙. Moreover, disks with SMBH masses up to 106.5 M⊙ present prominent traffic-jams in the outer area of the disks.
Figure B.1 shows the resulting pair-up efficiency, η, and trap fraction, ftrap, obtained with the K18 model.
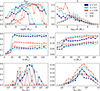 |
Fig. B.1. Fraction of pair-ups occurring within migration traps (left panels) and pair-up efficiency (right panels) as functions of SMBH mass M• (top row), migrator mass m (middle row), and initial radius Rinit (bottom row) in the K18 prescription. Color encodes the viscosity parameter α (orange: 0.01; teal: 0.1; navy blue: 0.4), and the two torque prescriptions are distinguished by marker shape and line style (squares and solid lines: G24; circles and dashed lines: B16). |
The pair-up efficiency, η, is generally lower than in the fiducial runs, peaking at roughly 0.3 for M• ≲ 106 M⊙ in the low-viscosity G24 case, while retaining similar trends in SMBH mass M• and in initial radius Rinit to those observed in subsection 3. On the other hand, the dependency on migrator mass m is flatter than in the fiducial case especially for disks with low viscosity (α = 0.01), implying that partial gap opening (K18) moderately suppresses the pair-up efficiency of larger mass migrators (with m ≳ 20 M⊙).
The fraction of pair-ups occurring within migration traps, ftrap, retains a similar behavior than in Figure 3 for the high-viscosity G24 case, remaining large (> 0.6) for most of the parameter space. In the low-viscosity G24 case, ftrap is large for M• ∈ [107, 108.7] M⊙ and ≲0.3 otherwise. Contrarily, in the B16 scenario, traffic-jam pair-ups are more relevant, especially at low viscosity for low SMBH mass. Therefore, ftrap < 0.2 with the exception of a certain α-dependent window: log M•/M⊙ ∈ [6.5, 8.6] for α = 0.01, log M•/M⊙ ∈ [6.0, 7.6] for α = 0.1, or log M•/M⊙ ∈ [5.8, 7.3] for α = 0.4. It retains a similar trend in both migrator mass m and initial radius Rinit than discussed in subsection 3.4.
We compute pair-up times, tpair, and evaluate how the K18 framework affects them. These pair-up times, shown via the 68% and 90% contour levels in Figure B.2, represent the elapsed time between the moment at which the single primary BH becomes embedded in the disk and the subsequent formation of a BBH. At low SMBH mass, M• ≲ 3 × 10⁶ M⊙, the normalized contrast parameter can reach larger values, Knorm ≳ 1, thus significantly reducing the local gas density Σ′ and slowing down the pair-up process, therefore increasing tpair by almost two orders of magnitude for the lowest SMBH mass explored, M• = 105 M⊙. In contrast, for M• ≳ 3 × 10⁶ M⊙, pair-up times are unaffected by the adopted Type II prescription.
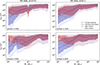 |
Fig. B.2. Pair-up times tpair as a function of SMBH mass in SG AGN disks, for different combinations of the viscosity parameter α (left: 0.01; right: 0.1) and torque prescriptions (top: G24; bottom: B16). Each panel shows a median line and contours enclosing 68% and 90% of the pair-up time distribution, based on our simulations. Results are shown for two different Type II migration prescriptions, indicated by color and line style. In blue, dashed lines: full gap opening, as in the main text (eq. 15). In red, continuous lines: partial gap opening, as in this appendix (K18). |
Overall, the adoption of the K18 prescription has different consequences depending on the torque model adopted.
In the G24 case, the position of traps is shifted toward regions of low contrast Knorm. For M• ≲ 106(107) M⊙ in the high-viscosity (low-viscosity) case, pair-up events happen in traffic jams in valleys of low contrast Knorm. For larger SMBH masses, both the pair-up efficiency and the relevance of migration traps are mostly unaffected.
In the B16 case, the pair-up process in disks with low SMBH mass (log M•/M⊙ ≲ 6) is strongly suppressed, and pair-up events often happen in the outskirts of the disk.
Consequently, the self-consistent treatment of gap opening lowers the pair-up efficiency of high-mass migrators and weakens the correlation between migration traps and binary formation sites.
All Figures
|
Fig. 1. Examples of torque profiles as a function of radial distance (in Schwarzschild radii) for BHs embedded in a SG disk. Each plot corresponds to a different combination of torque prescription (top: G24; bottom: B16), disk viscosity parameter α (left: α = 0.01; right: α = 0.1) and SMBH mass (log M•/M⊙ = 5.0, 6.3, 7.7, 9.0, represented in different colors). Solid and dashed lines indicate positive and negative net torques, respectively, while shaded regions denote uncertainty in the torque determined by computing it over a range of migrator masses between 5 M⊙ and 50 M⊙. Vertical dotted lines mark the locations of migration traps. |
| In the text | |
|
Fig. 2. Two-dimensional histograms showing the distribution of BBH pair-up locations in the radius–mass plane (R vs. M•), for different combinations of torque prescription (top: G24; bottom: B16) and disk viscosity α (left: 0.01; right: 0.1) in a SG disk. The color map indicates the number of pair-ups in each bin Npair. Red crosses mark the locations of migration traps. |
| In the text | |
|
Fig. 3. Fraction of binary pair-ups occurring within migration traps as a function of the SMBH mass. The vertical axis shows the occurrence ftrap of pair-up events that take place in proximity to predefined migration trap locations, while the horizontal axis shows the logarithm of the central SMBH mass. Different marker fillings indicate the BH generation (filled: 1g; hollow: Ng), while color encodes the viscosity parameter α (orange: 0.01; teal: 0.1; navy blue: 0.4). The two torque formalisms are distinguished by marker shape and line style (squares and solid lines: G24; circles and dashed lines: B16). Trap proximity is defined using a logarithmic tolerance on radial separation (see Section 3.2 for details). |
| In the text | |
|
Fig. 4. Histograms of binary pair-up radii Rpair (in units of Schwarzschild radii) for first-generation (1g) and Nth-generation (Ng) BHs, across a range of SMBH masses (log M•/M⊙ = 6, 7, 8 in the three columns, respectively) and viscosity parameters (upper row: α = 0.01; lower row: α = 0.1). Panels show the pair-up radii probability density functions (PDFs), normalized separately in each panel. The 1g distributions are shown as step histograms, while Ng distributions are overlaid either as filled or hatched histograms for visual distinction. Vertical dotted lines indicate the positions of migration traps identified from the torque profile. Color represents the migration model used (green: G24; purple: B16). |
| In the text | |
|
Fig. 5. Pair-up efficiency as a function of the central SMBH mass. The vertical axis shows the fraction of BHs that successfully form a binary during the simulation, while the horizontal axis shows the logarithm of the SMBH mass. As in Figure 3, different marker fillings indicate the BH generation (filled: 1g; hollow: Ng), color encodes the viscosity parameter α (orange: 0.01; teal: 0.1; navy blue: 0.4), and the two torque prescriptions are distinguished by marker shape and line style (squares and solid lines: G24; circles and dashed lines: B16). |
| In the text | |
|
Fig. 6. Pair-up efficiency (top panels) and fraction of pair-ups occurring within migration traps (bottom panels) as functions of initial radius Rinit (left) and migrator mass m (right). Color encodes the viscosity parameter α (orange: 0.01; teal: 0.1; navy blue: 0.4), and the two torque prescriptions are distinguished by marker shape and line style (squares and solid lines: G24; circles and dashed lines: B16). |
| In the text | |
|
Fig. 7. Two-dimensional distributions of the migration time tmigr as a function of the initial radius Rinit in SG AGN disks, for different combinations of the viscosity parameter α (left: 0.01; right: 0.1) and torque prescriptions (top: G24; bottom: B16). Each panel shows contours enclosing 40% and 68% of the migration time distribution, based on our simulations. Results are shown for four representative SMBH masses: log(M•/M⊙) = 5.0, 6.3, 7.7, 9.0, indicated by color. Solid (dashed) lines represent the migration timescale computed using the torque Γ in Eq. (1) (Γ0 in Eq. 12). Vertical dotted lines mark the locations of migration traps. |
| In the text | |
|
Fig. A.1. Radial profiles of surface density Σg (top panel) and aspect ratio h = H/R (bottom panel) of α = 0.1 disks, under different numerical treatments. The thin cyan line shows the original SG profile as published in Sirko & Goodman 2003, valid only for log M•/M⊙ = 8.0 and α = 0.01. Thicker colorful lines are extensions of the model to different SMBH masses (orange: log M•/M⊙ = 6.0; purple: 7.0; black: 8.0). Different line-styles distinguish the numerical method: solid lines are self-consistent solutions of the SG equations computed with pAGN, while dashed and dotted lines represent power-law scaling approximations from Vaccaro et al. (2024) and Grishin et al. (2024) respectively. The dot-dashed gray line is a Shakura & Sunyaev (1973) disk for comparison. Solid lines should be regarded as the most physically consistent profiles within this framework. |
| In the text | |
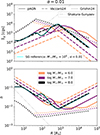 |
Fig. A.2. Same as Figure A.1, but for α = 0.01. |
| In the text | |
|
Fig. A.3. Two-dimensional histograms showing the distribution of BBH pair-up locations in the K18 model in the radius–mass plane (R vs M•), for different combinations of torque prescription (top: G24; bottom: B16) and disk viscosity α (left: 0.01; right: 0.1), for a SG disk model. The color map indicates the number of pair-ups in each bin, Npair. Pink dots mark the locations of migration traps in the K18 model, while red crosses mark the Type I trap positions (as in Figure 2). Pink contours show the values of the normalized contrast parameter Knorm. |
| In the text | |
|
Fig. B.1. Fraction of pair-ups occurring within migration traps (left panels) and pair-up efficiency (right panels) as functions of SMBH mass M• (top row), migrator mass m (middle row), and initial radius Rinit (bottom row) in the K18 prescription. Color encodes the viscosity parameter α (orange: 0.01; teal: 0.1; navy blue: 0.4), and the two torque prescriptions are distinguished by marker shape and line style (squares and solid lines: G24; circles and dashed lines: B16). |
| In the text | |
|
Fig. B.2. Pair-up times tpair as a function of SMBH mass in SG AGN disks, for different combinations of the viscosity parameter α (left: 0.01; right: 0.1) and torque prescriptions (top: G24; bottom: B16). Each panel shows a median line and contours enclosing 68% and 90% of the pair-up time distribution, based on our simulations. Results are shown for two different Type II migration prescriptions, indicated by color and line style. In blue, dashed lines: full gap opening, as in the main text (eq. 15). In red, continuous lines: partial gap opening, as in this appendix (K18). |
| In the text | |
Current usage metrics show cumulative count of Article Views (full-text article views including HTML views, PDF and ePub downloads, according to the available data) and Abstracts Views on Vision4Press platform.
Data correspond to usage on the plateform after 2015. The current usage metrics is available 48-96 hours after online publication and is updated daily on week days.
Initial download of the metrics may take a while.