Fig. B.1.
Download original image
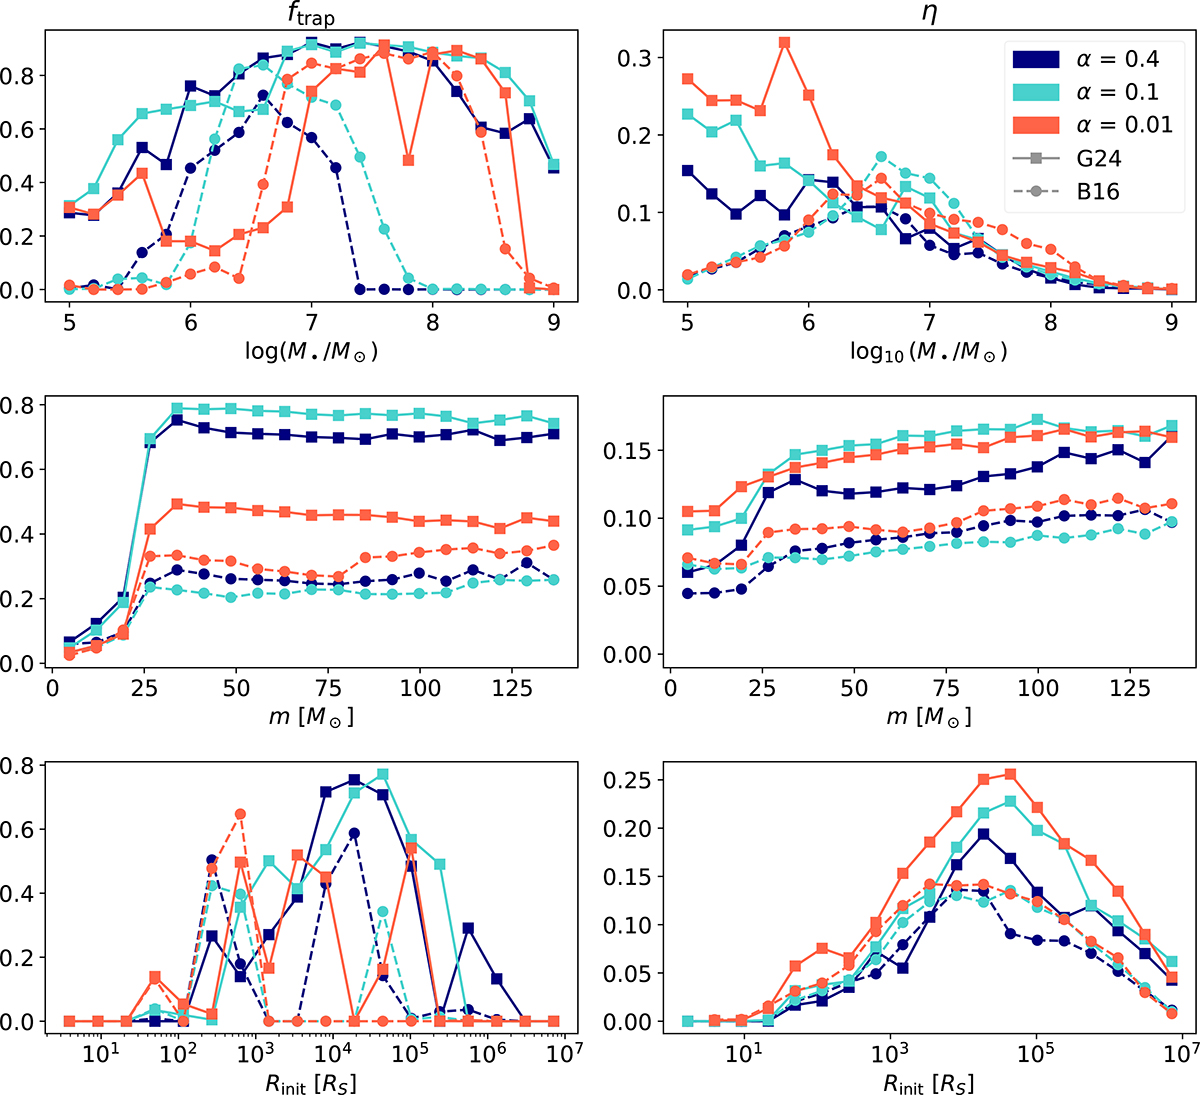
Fraction of pair-ups occurring within migration traps (left panels) and pair-up efficiency (right panels) as functions of SMBH mass M• (top row), migrator mass m (middle row), and initial radius Rinit (bottom row) in the K18 prescription. Color encodes the viscosity parameter α (orange: 0.01; teal: 0.1; navy blue: 0.4), and the two torque prescriptions are distinguished by marker shape and line style (squares and solid lines: G24; circles and dashed lines: B16).
Current usage metrics show cumulative count of Article Views (full-text article views including HTML views, PDF and ePub downloads, according to the available data) and Abstracts Views on Vision4Press platform.
Data correspond to usage on the plateform after 2015. The current usage metrics is available 48-96 hours after online publication and is updated daily on week days.
Initial download of the metrics may take a while.