Fig. B.2.
Download original image
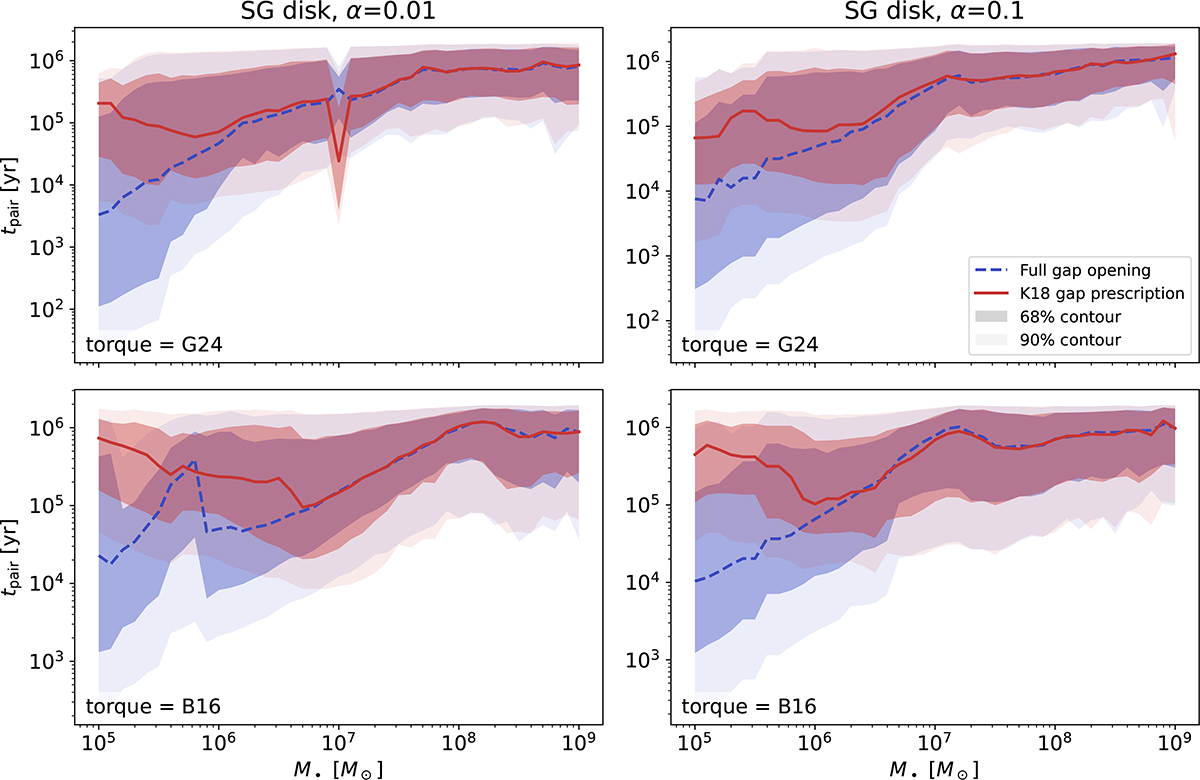
Pair-up times tpair as a function of SMBH mass in SG AGN disks, for different combinations of the viscosity parameter α (left: 0.01; right: 0.1) and torque prescriptions (top: G24; bottom: B16). Each panel shows a median line and contours enclosing 68% and 90% of the pair-up time distribution, based on our simulations. Results are shown for two different Type II migration prescriptions, indicated by color and line style. In blue, dashed lines: full gap opening, as in the main text (eq. 15). In red, continuous lines: partial gap opening, as in this appendix (K18).
Current usage metrics show cumulative count of Article Views (full-text article views including HTML views, PDF and ePub downloads, according to the available data) and Abstracts Views on Vision4Press platform.
Data correspond to usage on the plateform after 2015. The current usage metrics is available 48-96 hours after online publication and is updated daily on week days.
Initial download of the metrics may take a while.