Fig. 3.
Download original image
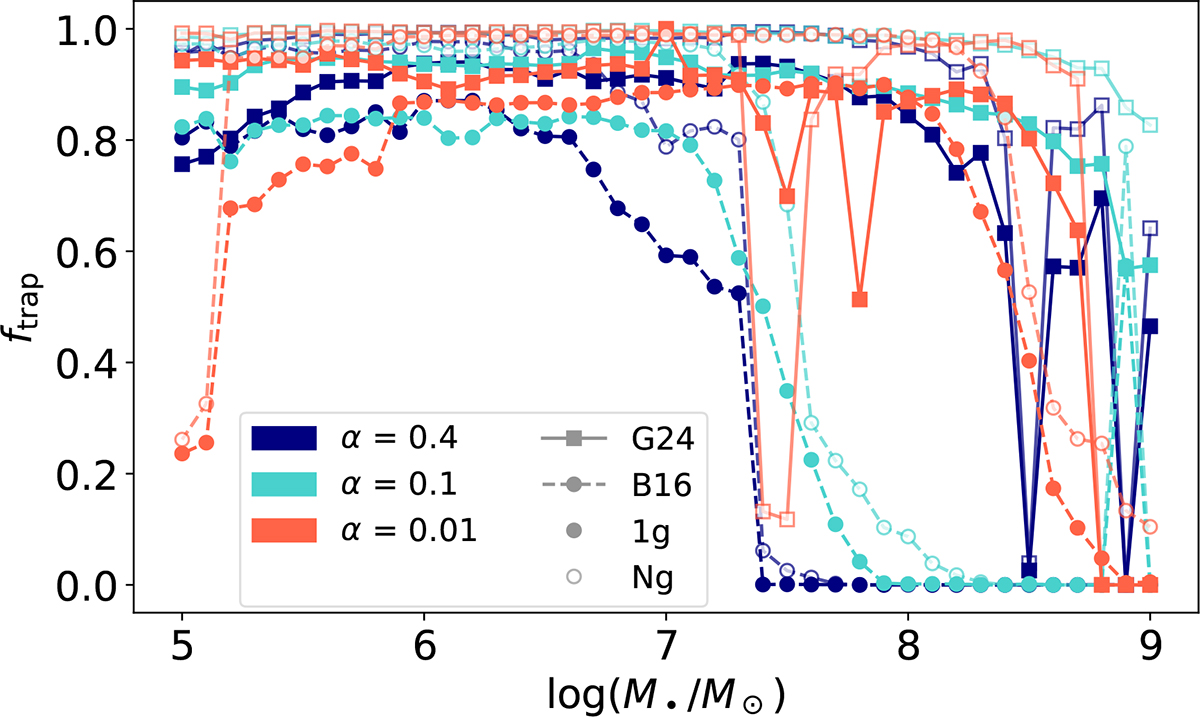
Fraction of binary pair-ups occurring within migration traps as a function of the SMBH mass. The vertical axis shows the occurrence ftrap of pair-up events that take place in proximity to predefined migration trap locations, while the horizontal axis shows the logarithm of the central SMBH mass. Different marker fillings indicate the BH generation (filled: 1g; hollow: Ng), while color encodes the viscosity parameter α (orange: 0.01; teal: 0.1; navy blue: 0.4). The two torque formalisms are distinguished by marker shape and line style (squares and solid lines: G24; circles and dashed lines: B16). Trap proximity is defined using a logarithmic tolerance on radial separation (see Section 3.2 for details).
Current usage metrics show cumulative count of Article Views (full-text article views including HTML views, PDF and ePub downloads, according to the available data) and Abstracts Views on Vision4Press platform.
Data correspond to usage on the plateform after 2015. The current usage metrics is available 48-96 hours after online publication and is updated daily on week days.
Initial download of the metrics may take a while.