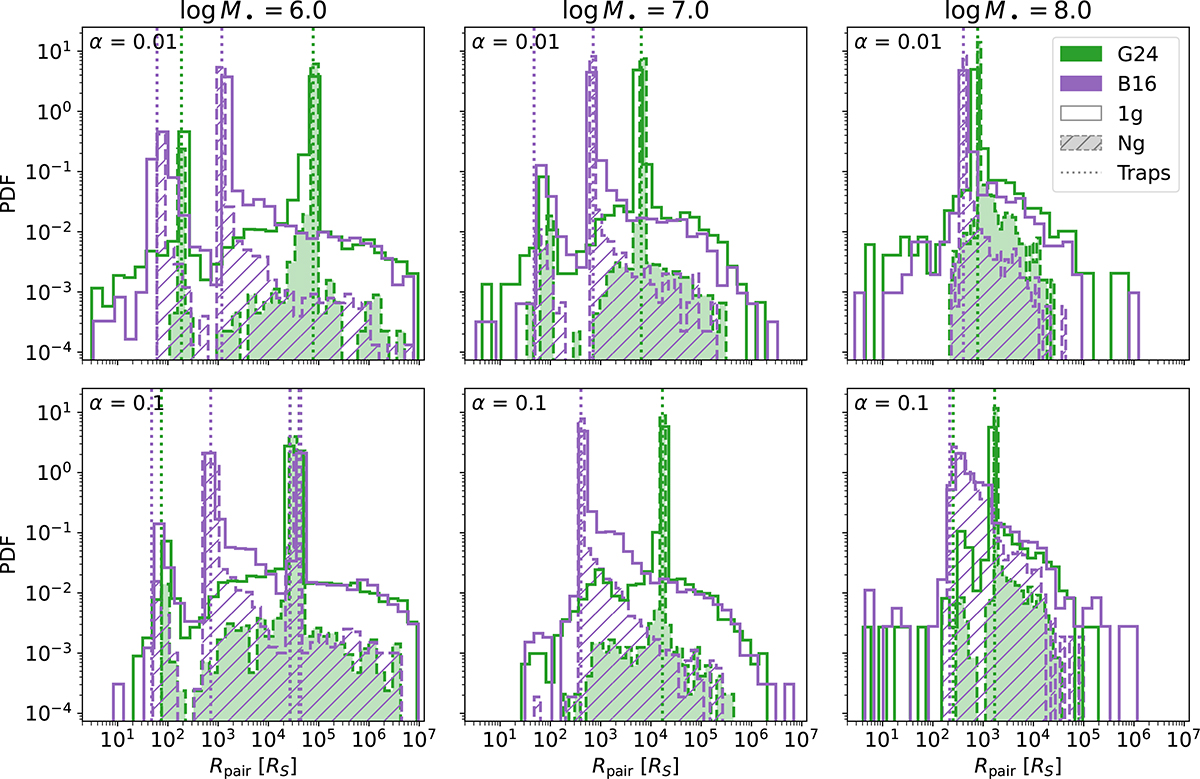
Fig. 4.
Download original image
Histograms of binary pair-up radii Rpair (in units of Schwarzschild radii) for first-generation (1g) and Nth-generation (Ng) BHs, across a range of SMBH masses (log M•/M⊙ = 6, 7, 8 in the three columns, respectively) and viscosity parameters (upper row: α = 0.01; lower row: α = 0.1). Panels show the pair-up radii probability density functions (PDFs), normalized separately in each panel. The 1g distributions are shown as step histograms, while Ng distributions are overlaid either as filled or hatched histograms for visual distinction. Vertical dotted lines indicate the positions of migration traps identified from the torque profile. Color represents the migration model used (green: G24; purple: B16).
Current usage metrics show cumulative count of Article Views (full-text article views including HTML views, PDF and ePub downloads, according to the available data) and Abstracts Views on Vision4Press platform.
Data correspond to usage on the plateform after 2015. The current usage metrics is available 48-96 hours after online publication and is updated daily on week days.
Initial download of the metrics may take a while.