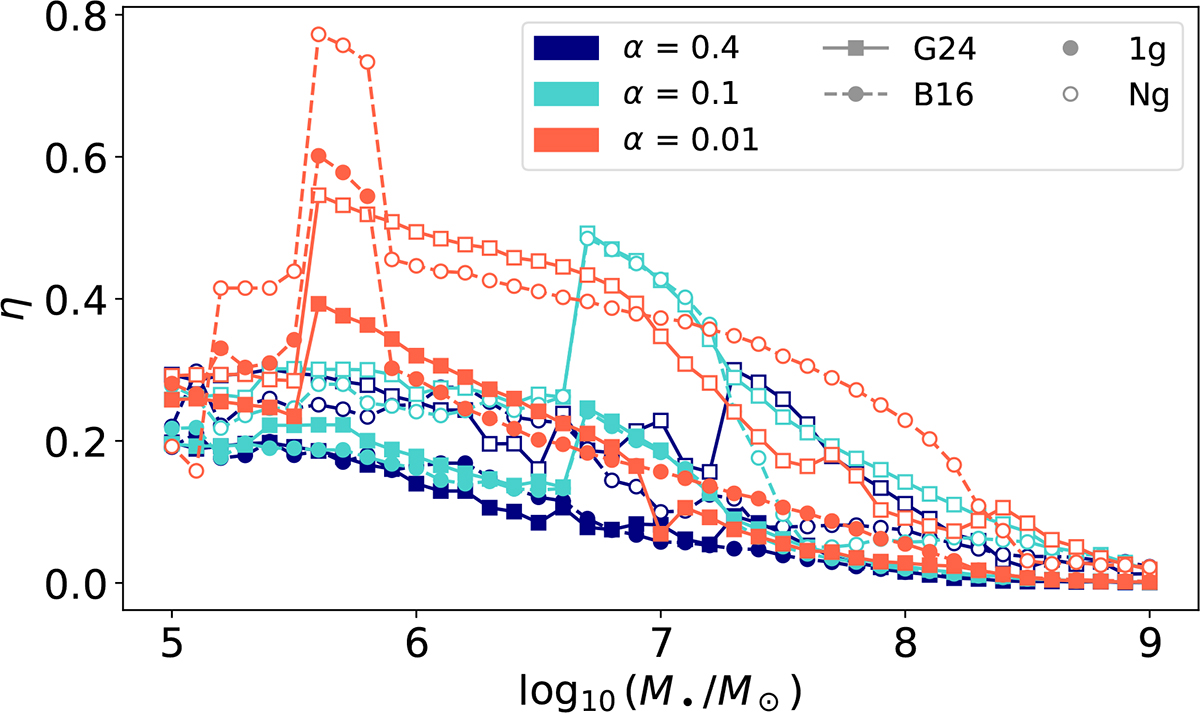
Fig. 5.
Download original image
Pair-up efficiency as a function of the central SMBH mass. The vertical axis shows the fraction of BHs that successfully form a binary during the simulation, while the horizontal axis shows the logarithm of the SMBH mass. As in Figure 3, different marker fillings indicate the BH generation (filled: 1g; hollow: Ng), color encodes the viscosity parameter α (orange: 0.01; teal: 0.1; navy blue: 0.4), and the two torque prescriptions are distinguished by marker shape and line style (squares and solid lines: G24; circles and dashed lines: B16).
Current usage metrics show cumulative count of Article Views (full-text article views including HTML views, PDF and ePub downloads, according to the available data) and Abstracts Views on Vision4Press platform.
Data correspond to usage on the plateform after 2015. The current usage metrics is available 48-96 hours after online publication and is updated daily on week days.
Initial download of the metrics may take a while.