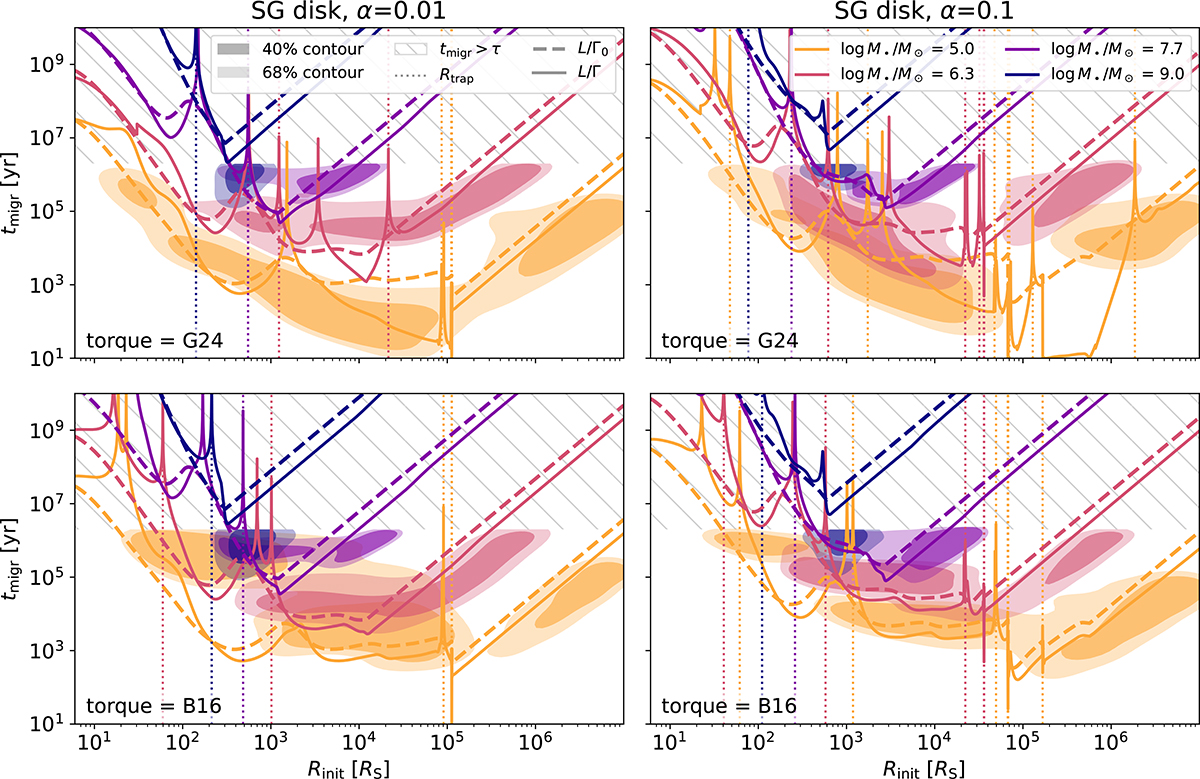
Fig. 7.
Download original image
Two-dimensional distributions of the migration time tmigr as a function of the initial radius Rinit in SG AGN disks, for different combinations of the viscosity parameter α (left: 0.01; right: 0.1) and torque prescriptions (top: G24; bottom: B16). Each panel shows contours enclosing 40% and 68% of the migration time distribution, based on our simulations. Results are shown for four representative SMBH masses: log(M•/M⊙) = 5.0, 6.3, 7.7, 9.0, indicated by color. Solid (dashed) lines represent the migration timescale computed using the torque Γ in Eq. (1) (Γ0 in Eq. 12). Vertical dotted lines mark the locations of migration traps.
Current usage metrics show cumulative count of Article Views (full-text article views including HTML views, PDF and ePub downloads, according to the available data) and Abstracts Views on Vision4Press platform.
Data correspond to usage on the plateform after 2015. The current usage metrics is available 48-96 hours after online publication and is updated daily on week days.
Initial download of the metrics may take a while.