Fig. A.1.
Download original image
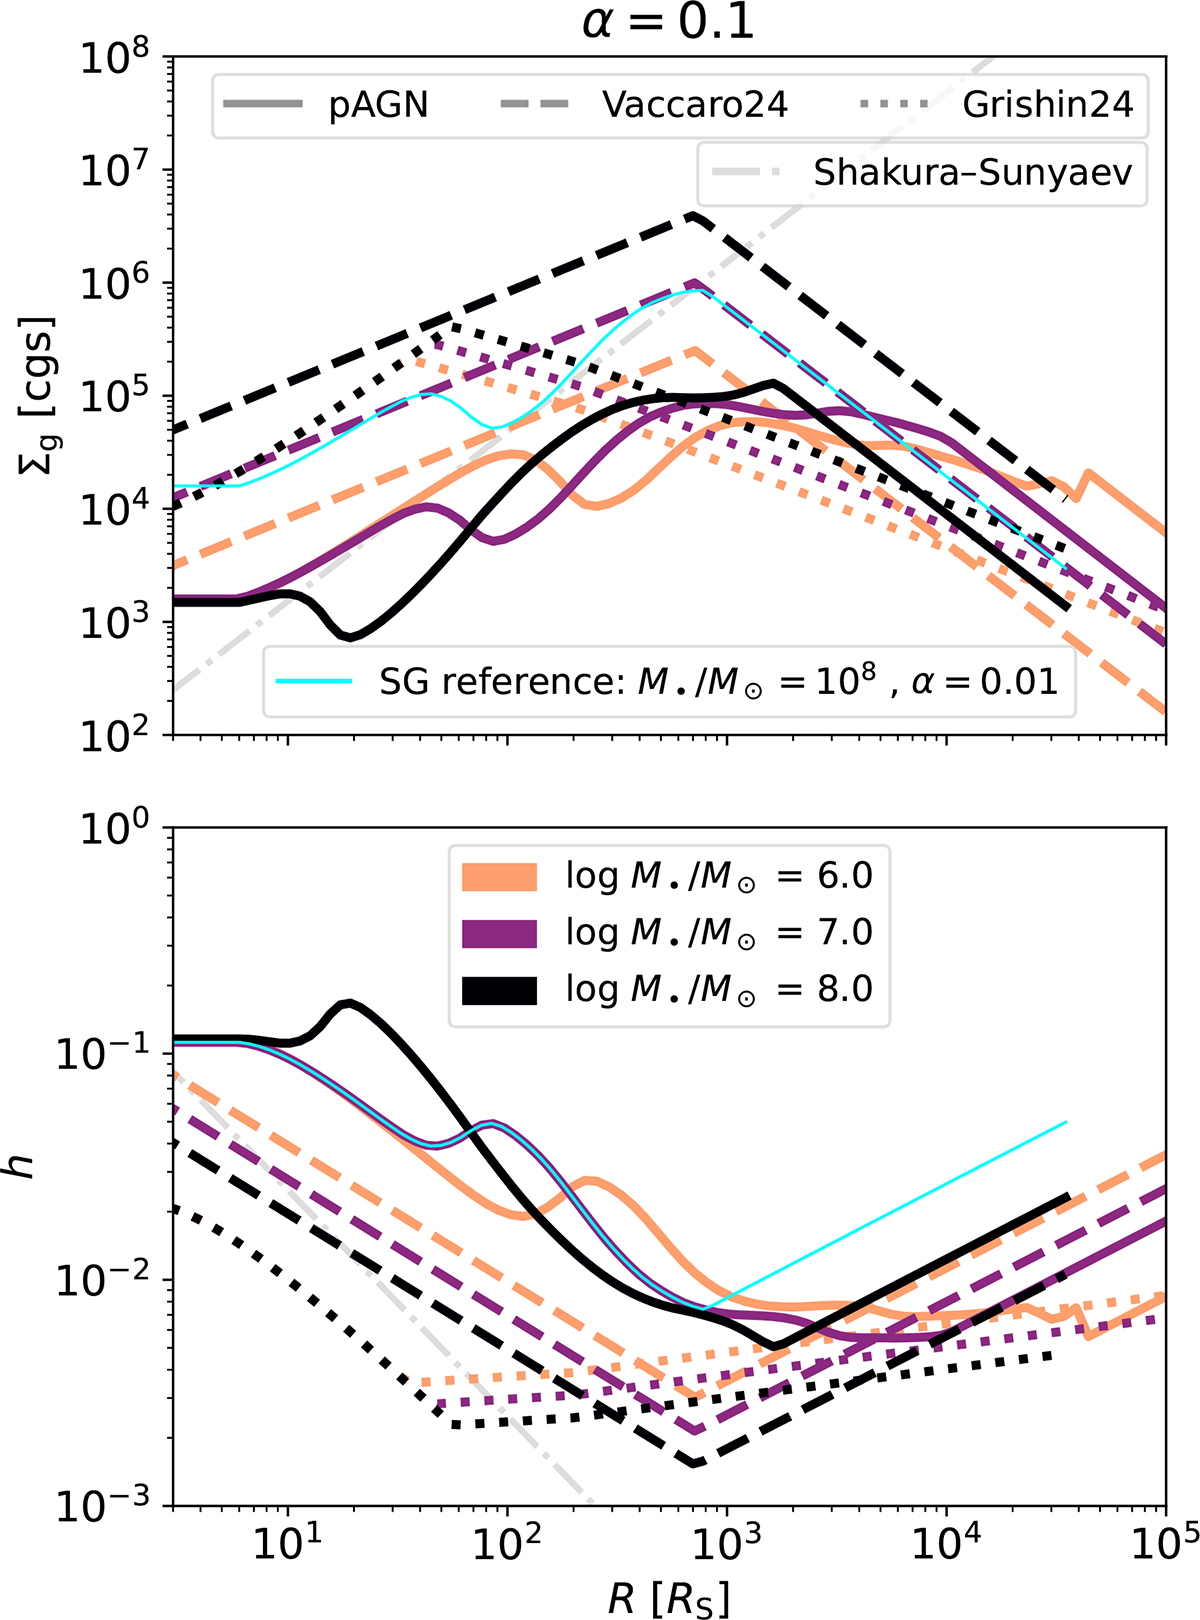
Radial profiles of surface density Σg (top panel) and aspect ratio h = H/R (bottom panel) of α = 0.1 disks, under different numerical treatments. The thin cyan line shows the original SG profile as published in Sirko & Goodman 2003, valid only for log M•/M⊙ = 8.0 and α = 0.01. Thicker colorful lines are extensions of the model to different SMBH masses (orange: log M•/M⊙ = 6.0; purple: 7.0; black: 8.0). Different line-styles distinguish the numerical method: solid lines are self-consistent solutions of the SG equations computed with pAGN, while dashed and dotted lines represent power-law scaling approximations from Vaccaro et al. (2024) and Grishin et al. (2024) respectively. The dot-dashed gray line is a Shakura & Sunyaev (1973) disk for comparison. Solid lines should be regarded as the most physically consistent profiles within this framework.
Current usage metrics show cumulative count of Article Views (full-text article views including HTML views, PDF and ePub downloads, according to the available data) and Abstracts Views on Vision4Press platform.
Data correspond to usage on the plateform after 2015. The current usage metrics is available 48-96 hours after online publication and is updated daily on week days.
Initial download of the metrics may take a while.