Fig. 10.
Download original image
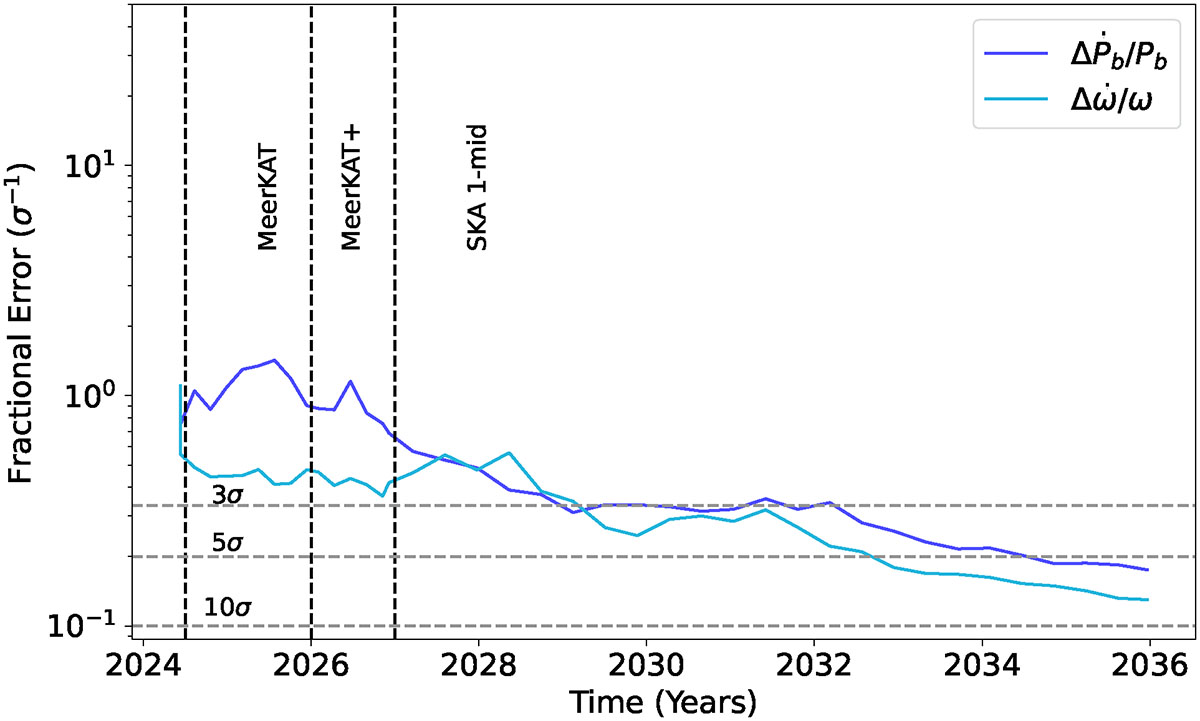
Improvement in the fractional error of orbital period decay, Ṗb, and ![]() based on the simulations described in Sect. 4. The improvement in detection significance of the orbital period derivative (Ṗb) is shown in purple and the relative advance of periastron (
based on the simulations described in Sect. 4. The improvement in detection significance of the orbital period derivative (Ṗb) is shown in purple and the relative advance of periastron (![]() ) is shown in light blue. The vertical lines show the different simulated data; MeerKAT, MeerKAT+, and SKA 1-mid and the horizontal grey dashed lines show the significance thresholds.
) is shown in light blue. The vertical lines show the different simulated data; MeerKAT, MeerKAT+, and SKA 1-mid and the horizontal grey dashed lines show the significance thresholds.
Current usage metrics show cumulative count of Article Views (full-text article views including HTML views, PDF and ePub downloads, according to the available data) and Abstracts Views on Vision4Press platform.
Data correspond to usage on the plateform after 2015. The current usage metrics is available 48-96 hours after online publication and is updated daily on week days.
Initial download of the metrics may take a while.