Fig. 5.
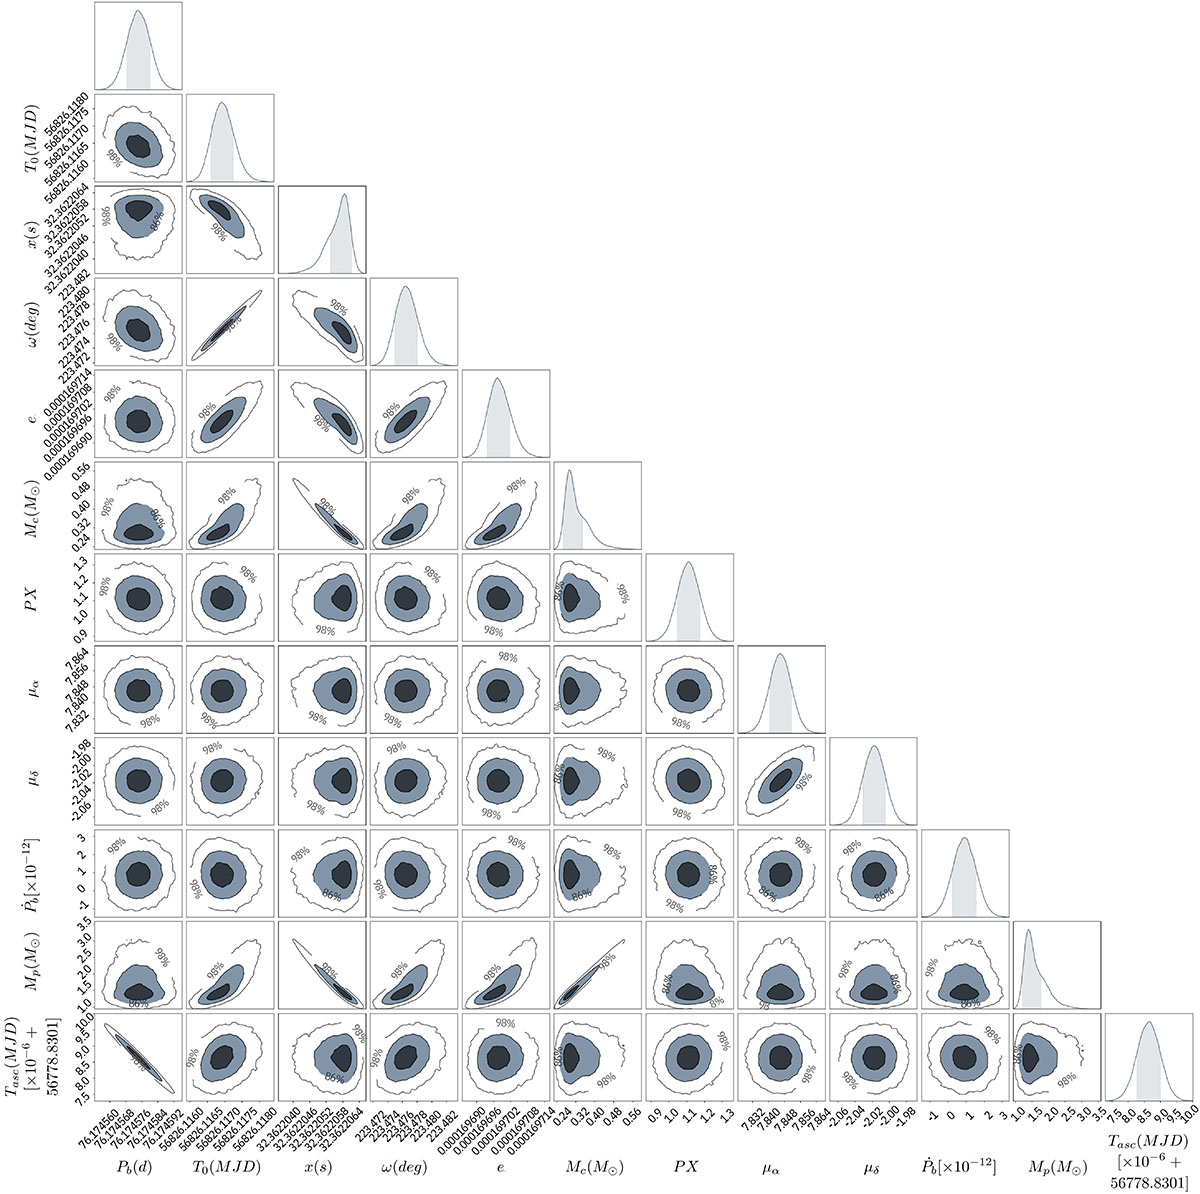
Download original image
Output posterior distribution for the relevant orbital and post-Keplerian parameter subset of timing parameters for J1455−3330. These were obtained from temponest using the T2 orbital model, which includes a DM-only noise model. The plot was generated using the chainconsumer package. Full details of the parameters are provided in Table 4. The obtained pulsar mass (Mp) distribution was computed using the mass function and the posterior distributions on Mc, i, x, and Pb. The 1D marginalised posterior distributions for each parameter are shown on the diagonal subplots, and the shaded region indicates the 1-σ credibility interval. The 2D contours on the off-diagonal subplots show the correlation between pairs of parameters, where the contours mark the 39%, 86%, and 98% credibility regions respectively.
Current usage metrics show cumulative count of Article Views (full-text article views including HTML views, PDF and ePub downloads, according to the available data) and Abstracts Views on Vision4Press platform.
Data correspond to usage on the plateform after 2015. The current usage metrics is available 48-96 hours after online publication and is updated daily on week days.
Initial download of the metrics may take a while.