Fig. 7.
Download original image
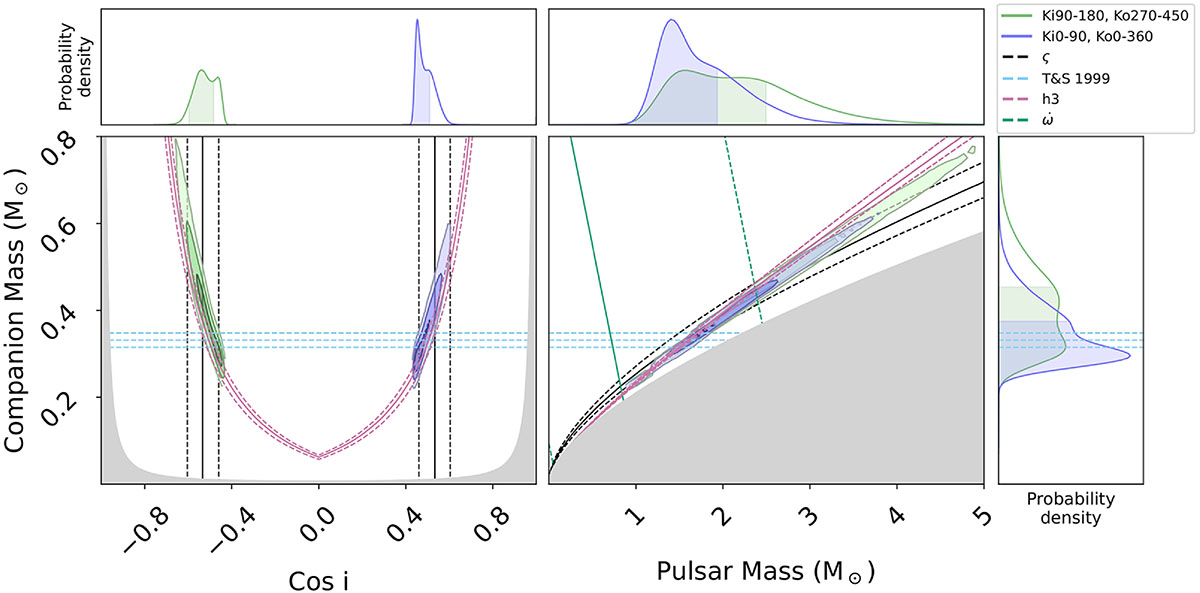
Constraints on the companion mass as a function of the cosine of the orbital inclination (left), and as a function of the pulsar mass (right). In the left plot, the grey region is excluded by the requirement that the pulsar mass must be greater than zero. In the right plot, the mass values in the grey region are excluded by the mass function. The black solid and dashed lines and the pink solid and dashed lines represent the median, and 1 sigma ς and h3 measurements using the ELL1H model respectively. The solid contours enclosing progressively darker shades of purple include 98%, 86%, and 39% confidence limits of the 2D probability density function from the T2 timing model solutions calculated by temponest with priors of i ranging from 90 to 180 degrees and Ω ranging from 270 to 450 degrees. The solid contours enclosing progressively darker shades of purple include 98%, 86%, and 39% confidence limit of the 2D probability density function from the T2 timing model solutions calculated by temponest with priors of i ranging from 0 to 90 degrees and Ω ranging from 0 to 360 degrees. The marginalised posterior probability distributions for cos i, Mc and Mp are displayed for each axis. The shaded region on the marginalised plots at the top and the right represents the 68% confidence limit of the estimated parameter.
Current usage metrics show cumulative count of Article Views (full-text article views including HTML views, PDF and ePub downloads, according to the available data) and Abstracts Views on Vision4Press platform.
Data correspond to usage on the plateform after 2015. The current usage metrics is available 48-96 hours after online publication and is updated daily on week days.
Initial download of the metrics may take a while.