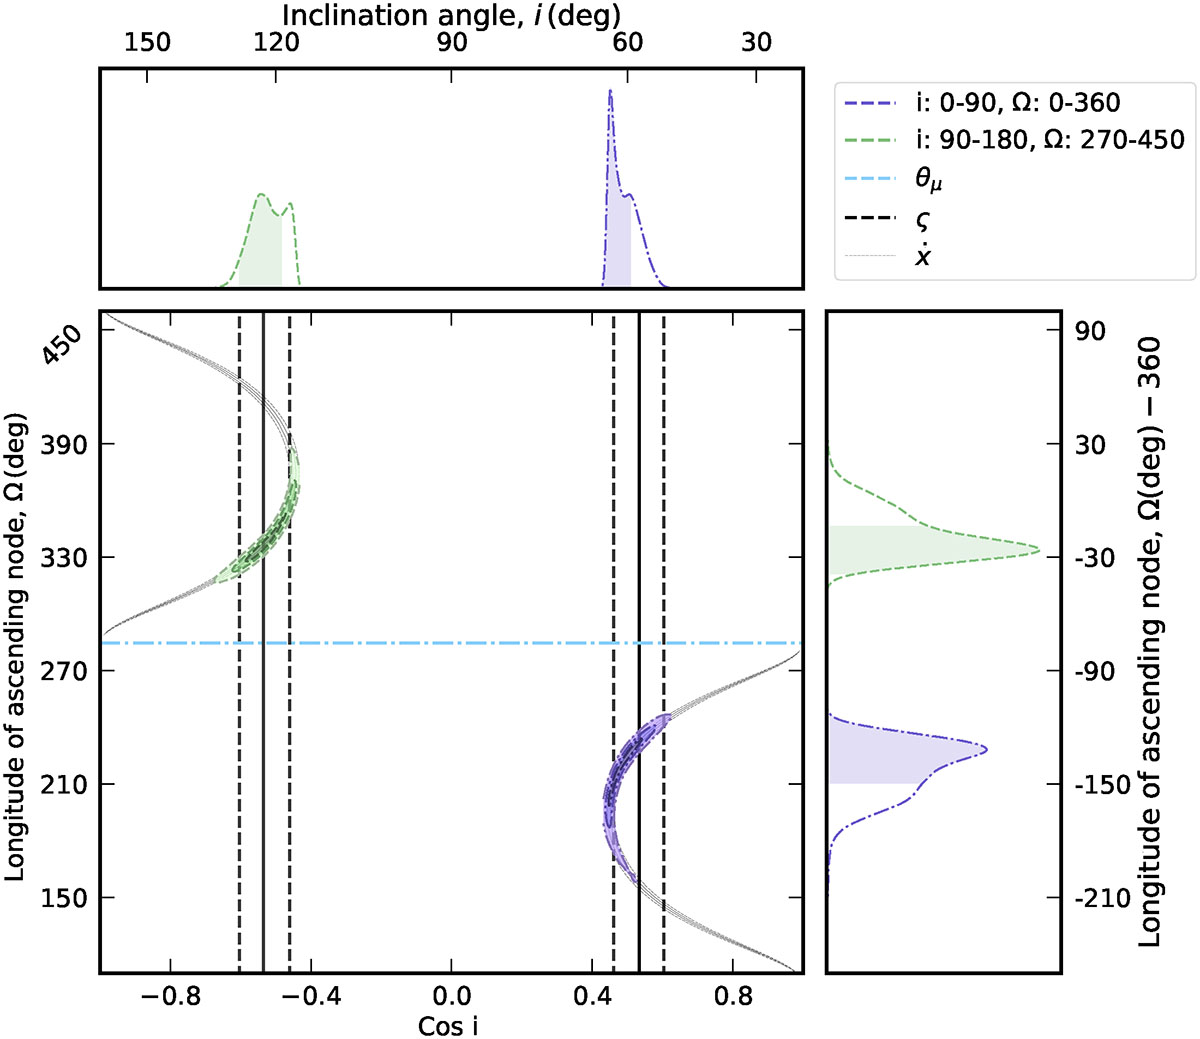
Fig. 8.
Download original image
Plot of the allowable orbital orientation of J1455−3330. The black lines represent constraints from ς, and grey contours show the constraint from ẋ (1-σ solid, 3-σ dashed). The green dashed contours show the constraints from temponest using priors where the inclination angle ranges from 90 to 180 and Ω ranges from 270 to 450 (–90–90°). The purple dashed contours show the constraints from temponest using priors where inclination angle, i, ranges from 0 to 90 and longitude of ascending node Ω ranges from 0 to 360. The light blue dashed horizontal line shows the position angle of the proper motion. The marginalised constraints on cos i and Ω are shown as 1D histograms (in green and purple) in the top and side panels.
Current usage metrics show cumulative count of Article Views (full-text article views including HTML views, PDF and ePub downloads, according to the available data) and Abstracts Views on Vision4Press platform.
Data correspond to usage on the plateform after 2015. The current usage metrics is available 48-96 hours after online publication and is updated daily on week days.
Initial download of the metrics may take a while.