Fig. 1.
Download original image
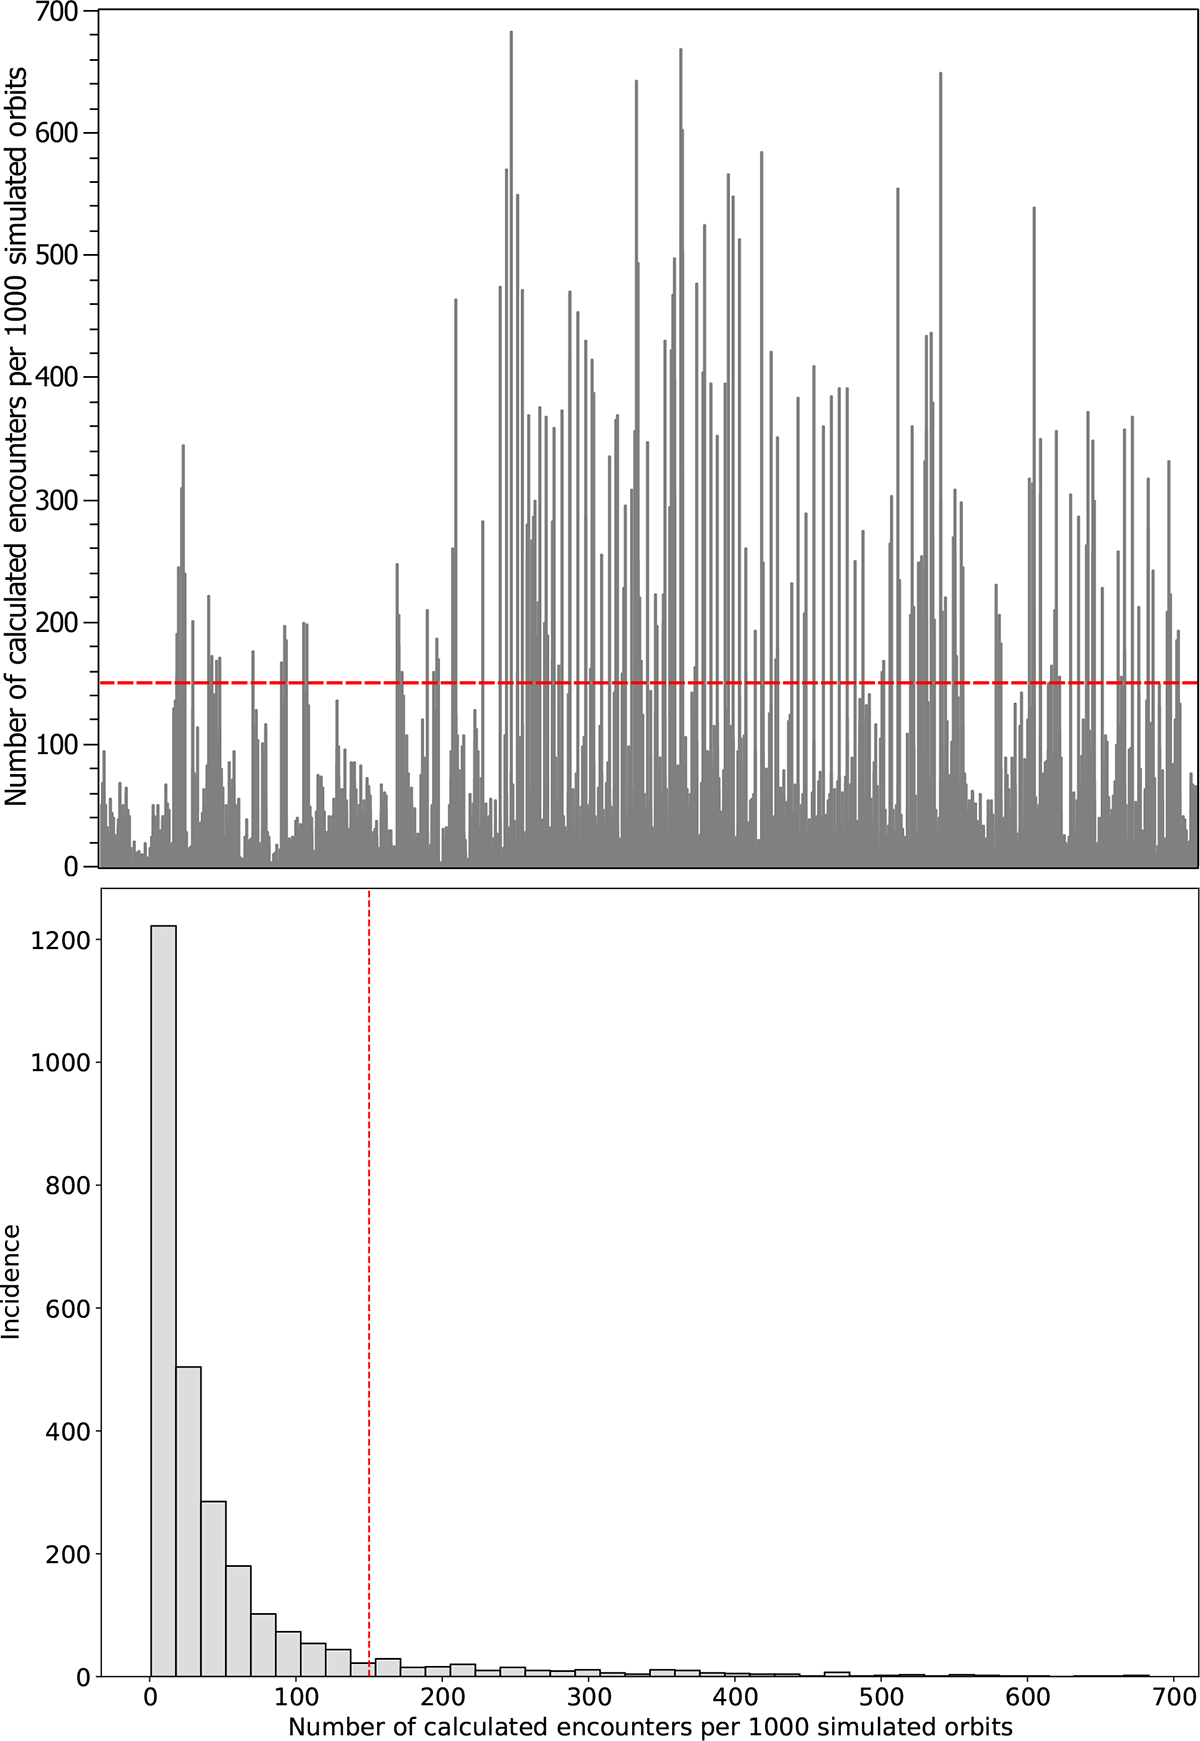
Number of calculated encounters per 1000 simulated orbits of the remaining candidates. Upper panel: Bar chart of the calculated encounters of every star-subgroup pair. Lower panel: Histogram displaying how often a certain number of encounters occurs in the sample. The identified threshold of 150 encounters per 1000 simulated orbits is indicated by a dashed red line.
Current usage metrics show cumulative count of Article Views (full-text article views including HTML views, PDF and ePub downloads, according to the available data) and Abstracts Views on Vision4Press platform.
Data correspond to usage on the plateform after 2015. The current usage metrics is available 48-96 hours after online publication and is updated daily on week days.
Initial download of the metrics may take a while.