| Issue |
A&A
Volume 708, April 2026
|
|
|---|---|---|
| Article Number | A222 | |
| Number of page(s) | 25 | |
| Section | Stellar structure and evolution | |
| DOI | https://doi.org/10.1051/0004-6361/202556778 | |
| Published online | 08 April 2026 | |
A study of runaway stars originating in the Scorpius-Centaurus-Lupus association
1
Astrophysical Institute, Friedrich-Schiller-University Jena, Schillergäßchen 2, 07745 Jena, Germany
2
Byurakan Astrophysical Observatory after V. A. Ambartsumian, 0213 Byurakan, Aragatsotn Province, 378433, Armenia
3
Astrophysical Research Laboratory of Physics Institute, Yerevan State University, 1 Alek Manukyan St., Yerevan, Armenia
★ Corresponding author: This email address is being protected from spambots. You need JavaScript enabled to view it.
Received:
7
August
2025
Accepted:
29
December
2025
Abstract
Context. Runaway stars are OB-type stars with an unusually high space velocity, and they originate in a stellar cluster. OB runaways are produced by dynamical ejection or by a supernova explosion in a multiple system, and a hybrid scenario is also possible.
Aims. Being the closest OB association to Earth, the Scorpius-Centaurus-Lupus association is an extraordinarily interesting subject of research, and it has been identified as the parent cluster of several known runaway stars. Our aim with this work is to find new runaway candidates originating in the Scorpius-Centaurus-Lupus association and its recently found subgroups using new Gaia data.
Methods. By tracing back in time the flight paths of all known OB-type stars within a 1.7 kpc radius around the Sun and those of the individual subgroups of Scorpius-Centaurus-Lupus, we intend to find close encounters between runaway candidates and the studied subgroups in order to find the likeliest parent group(s) for each candidate. As input data, we largely use Gaia DR3 and HIPPARCOS astrometry as well as radial velocities from the literature.
Results. We present eight runaway candidates originating from Scorpius-Centaurus-Lupus (3D space velocity 20–67 km s−1), of which at least three were previously known as such. Additionally, we find 22 walkaway stars (10–20 km s−1), i.e., “slower” runaway stars that may have been ejected from their parent group by the same mechanisms as their faster counterparts.
Conclusions. We identified five new runaway stars. Among the total number of eight runaway stars (including one, ζ Oph, that is likely produced by the binary supernova scenario), up to two might have been ejected dynamically, whereas most were produced in a binary-supernova scenario. Further traceback studies may find some of the neutron stars born in these supernovae, and some of them are possibly responsible for the 60Fe found in Earth’s crust. We confirm that the runaway star ζ Oph and pulsar PSR B1706-16 originated from Scorpius-Centaurus-Lupus in a recent nearby binary supernova, most probably from subgroup SigMA 15, which has more than one thousand member stars.
Key words: stars: early-type / stars: individual: zeta Oph
© The Authors 2026
 Open Access article, published by EDP Sciences, under the terms of the Creative Commons Attribution License (https://creativecommons.org/licenses/by/4.0), which permits unrestricted use, distribution, and reproduction in any medium, provided the original work is properly cited.
This article is published in open access under the Subscribe to Open model. This email address is being protected from spambots. You need JavaScript enabled to view it. to support open access publication.
1. Introduction
A few hundred stars of spectral types O and B with unusually high space velocities have been identified as so-called runaway stars, as introduced by Blaauw (1961). They can reach velocities of up to approximately 200 km s−1.
Whereas Blaauw originally used a threshold value of 40 km s−1 to define what constitutes a runaway star as opposed to a normal slower-moving Population iearly-type star, today this velocity cutoff is commonly placed lower than that. By examining observed velocity distributions of early-type stars, it has been determined that these velocity dispersions are not satisfactorily describable by a single Maxwellian curve on the lower end of the stellar velocity spectrum since they commonly exhibit a longer tail toward higher velocities (see, e.g., Stone 1979 and Tetzlaff et al. 2011). Thus, Stone (1979) proposed that there are two groups of early-type stars that can be described using two separate Maxwellian distributions. The first group is the low-velocity group, which contains normal Population istars, whereas the second group is the high-velocity group, which consists of stars with peculiar velocities larger than normal for this stellar population. Obviously, most runaway stars will belong to the high-velocity group. When fitting two Maxwellian distributions to the observed velocities of the members of each of these groups, the two curves will intersect at some point. Tetzlaff et al. (2011) found this intersection at a velocity of 28 km s−1. Stone (1979) plotted similar distributions for a sample of O-type stars and found the intersection of the two Maxwellian curves at 25 km s−1. The threshold velocity for a star to be considered a possible runaway candidate is usually placed in the range of 20–40 km s−1. In this work, we use 20 km s−1, which is still supersonic. Actually, the three-dimensional velocity of a runaway star should exceed the peculiar or escape velocity of the parent cluster.
Today, two mechanisms are known to be responsible for the high space velocities of runaway stars: the binary-supernova scenario (BSS) and the dynamical ejection scenario (DES). Which of these two scenarios is the dominant driving force in the formation of runaway stars is still a subject of debate, but it has been determined that both do indeed occur in nature (see, e.g., Hoogerwerf et al. 2000 and Dinçel et al. 2015).
The BSS was introduced by Zwicky (1957) and was identified as a mechanism producing high runaway velocities by Blaauw (1961). In this scenario, the runaway star was previously part of a binary system in which the more massive component exploded in a supernova. In the majority of cases where a supernova occurs in a binary system with components of spectral types O or B, after the explosion a neutron star with a typical mass of 1.4 M⊙ (Seeds & Backman 2009), a supernova remnant of negligible mass, and the original secondary component of the binary system will be left behind. Blaauw (1961) found that if at least half of the total initial mass leaves the binary system during the supernova explosion, the system will become unbound. Thus, the former secondary is released and continues to move in a straight line at a speed that is comparable to its former orbital velocity, and thus it becomes a runaway star. However, it is also possible that the system breaks apart even if less than half of the total mass is lost. Neutron stars receive strong kicks at birth, resulting in the observed velocities of neutron stars that are as high as several 100 km s−1 (e.g., Hobbs et al. 2005). These kicks are created by asymmetries of the supernova explosion (see, e.g., Janka & Mueller 1994 and Lai 2003). Thus, the neutron star itself is ejected from the initial binary system. With the loss of its companion, the former secondary now moves though space as a runaway star. As a result, the majority of binary systems of massive stars in which one component explodes in a supernova break apart as a consequence of that first supernova (Renzo et al. 2019). Since a certain amount of time is required for stars to burn – and finally exhaust – their fuel and eventually explode in supernova events, a BSS is expected to occur 3–30 Myr after an (OB) association is born. It is worth mentioning that in the case of the BSS, identifying a runaway star’s parent cluster and the cluster age helps reconstruct the evolutionary history of the pre-supernova system by providing important constraints on parameters such as the mass of the supernova progenitor and the mass lost from the system during the supernova (see, e.g., van der Meij et al. 2021, Ekström et al. 2012, and Neuhäuser et al. 2020).
In a DES, gravitational interaction between massive stars leads to the ejection of runaway stars, as first described by Poveda et al. (1967) and Gies & Bolton (1986). This mechanism can occur either in dense clusters or during close encounters of multiple systems. According to Hoogerwerf et al. (2001), and references therein, encounters between two binary systems most efficiently produce dynamically ejected runaway stars. If two such binary systems interact gravitationally, there are four possible outcomes. The first possible result is two binary systems. Another possibility is that three stars form a hierarchical triple system, and the fourth star becomes a single star. A third possible outcome is one binary system and two single stars. The last possibility is that all four involved stars become single stars. Hoogerwerf et al. (2001) and papers cited therein note that the third possible result of one binary and two single stars is the most frequent outcome. Being the most massive component in this scenario, the resulting binary is not expected to move at a high velocity, and thus, only the two resulting single stars would be considered runaway stars, which is why most runaway stars created in a DES should be single stars. Obviously, the higher the binary fraction of a cluster or an association, the more efficient the DES will be. Additionally, high cluster density is also favorable for efficiency. Thus, if an OB association has been determined as the likely origin of a runaway star, it is to be expected that the star was ejected soon after the association’s formation since OB associations are usually expanding. Generally, most DES ejections occur during the first 3 Myr of an association’s lifetime (e.g., Hoogerwerf et al. 2001).
Hoogerwerf et al. (2000) and Hoogerwerf et al. (2001) found one case each for a DES (μ Col, ι Ori, AE Aur from Orion) and for a BSS (ζ Oph) and concluded from these very low number statistics that both scenarios are roughly equally likely. However, recent work by Carretero-Castrillo et al. (2023) – which, similar to our work in this project, utilizes Gaia DR3 data – suggests that the DES is more likely than the BSS. They find that O-type stars are more often runaway stars compared to Be-type stars and that these O-type runaway stars also tend to move at higher velocities than Be-type runaway stars. As is also discussed further in the following paragraphs, especially fast and massive runaways are usually expected from a DES, which is why Carretero-Castrillo et al. (2023) arrive at the conclusion that the DES occurs at a higher frequency than the BSS. Another recent study conducted by Stoop et al. (2024) has also found that the occurrence of the DES may have been underestimated. Here, we aim to significantly improve the statistics regarding which scenario is the likeliest to happen – specifically for the Scorpius-Centaurus-Lupus (Sco-Cen-Lup) star forming complex, the closest such structure.
In addition to the BSS and DES, a combination is also possible, the two-step ejection (Pflamm-Altenburg & Kroupa 2010), where in the first step, a binary is dynamically ejected from its parent cluster, and in the second step, one of the two stars eventually explodes in a supernova. Pflamm-Altenburg & Kroupa (2010) note that the current motion of runaway stars produced in such a two-step scenario would provide no indication of where they were originally ejected. Thus, in this work, we focus on the BSS and DES.
Ejection by the BSS and DES can of course also occur at lower velocities. Many isolated OB-type stars that are observed to move away from possible parent associations have peculiar velocities below certain threshold values for runaway stars, which – as previously discussed – are usually set between 20 km s−1 and 40 km s−1. Based on simulations, Renzo et al. (2019) argue that even most of the stars ejected from disrupted binary systems will be slow. Sometimes these slower stars are referred to as “walkaway stars” (see, e.g., de Mink et al. 2012 and Renzo et al. 2019).
Renzo et al. (2019) conclude from their simulations that the velocity distribution of stars ejected from disrupted binary systems peaks at approximately 6 km s−1. Additionally, they find that the runaway velocities these simulations produce only rarely exceed 60 km s−1, leading them to the conclusion that many of the observed runaway stars with significantly larger peculiar velocities than that may have instead gained these speeds from being dynamically ejected from a cluster.
Since the velocity distribution of ejected stars is continuous, any distinction between runaways and walkaways at a certain velocity threshold is somewhat arbitrary and serves the purpose of emphasizing the fact that slower-moving stars should not be completely discarded as potential candidates, especially in the search for pre-supernova companions of neutron stars or even when identifying now-ejected former members of stellar associations.
The Sco-Cen-Lup association is the closest OB association to Earth. The fact that the association hosts a large number of stars massive enough to explode in supernovae once they have reached the end of their lives suggests it as an interesting possible origin of runaway stars.
Sco-Cen-Lup spans distances of ∼100–150 pc and is approximately ∼100–200 pc wide (de Zeeuw et al. 1999; Wright & Mamajek 2018; Ratzenböck et al. 2023a). Ages of members have been determined to range from 3 Myr to 19 Myr old (Ratzenböck et al. 2023a).
By studying the kinematics and dynamics of the association, Wright & Mamajek (2018) found evidence that Sco-Cen-Lup was not formed as a monolithic complex in a single star formation event. Rather, several smaller-scale bursts in stellar formation at different locations and at different points in time are thought to have produced smaller groups, contributing to Sco-Cen-Lup’s overall structure.
According to Blaauw (1946), Sco-Cen-Lup consists of Upper Scorpius (US), Upper Centaurus-Lupus (UCL), and Lower Centaurus-Crux (LCC), which lie adjacent on the sky.
Wright & Mamajek (2018) find that both US and LCC can reasonably be approximated as spherical in shape, whereas UCL appears more elongated in one direction, making it more oval shaped. Based on data from Gaia’s first data release (Gaia DR1), the authors found mean distances of  for US,
  for UCL, and
  for LCC.
However, further evidence suggests that Sco-Cen-Lup is even more substructured than that, as US, UCL, and LCC have been found to have median ages of 11 Myr, 16 Myr, and 17 Myr, respectively, but the age distributions of their members are broad (see Pecaut & Mamajek 2016 and Wright & Mamajek 2018).
Additionally, by analyzing the motion of stars within US, UCL, and LCC each, Wright & Mamajek (2018) observed a certain degree of kinematic substructuring within all three groups, where the term “kinematic substructuring” describes the fact that there seem to be established regions within the groups where stars tend to have comparable motions. These regions, however, are different from others in that same group, which effectively creates smaller subgroups within US, UCL, and LCC.
To study this observed substructuring more closely, Ratzenböck et al. (2023b) applied a clustering method called “significance mode analysis (SigMA)” to Sco-Cen-Lup. This method identifies co-spatial and co-moving groups of stars by examining density peaks and density dips within a stellar association. By applying SigMA and studying the ages of the resulting subgroups, Ratzenböck et al. (2023b) and Ratzenböck et al. (2023a) identified a total of 37 small groups, the oldest of which tend to lie at the center of Sco-Cen-Lup, whereas the younger groups are located farther out, implying that the association was formed inside out. Table A.1 lists several properties of those subgroups that are relevant for this project (see Sect. 2.2), as determined by Ratzenböck et al. (2023b) as well as Ratzenböck et al. (2023a). Ratzenböck et al. (2023b) have enumerated the groups with a SigMA identification number, as presented in the first column of the table. Additionally, they have provided group names and the classical substructure the groups belong to, i.e., the traditional three subgroups US, UCL, and LCC. The fifth column of Table A.1 lists the ages of the subgroups. These ages were determined by Ratzenböck et al. (2023a) by fitting model isochrones to absolute magnitudes, MG, of group members plotted over their GBP − GRP color indices from Gaia, where “BP” stands for Gaia’s “blue photometer” and “RP” stands for Gaia’s “red photometer.” Additionally, the right ascension, α, and declination, δ, of the center point of the groups are listed, as well as parallaxes, π, and proper motions in the direction of right ascension ( ) and declination (μδ) from Ratzenböck et al. (2023b); these parameters are needed for tracing back the past trajectories of the subgroups, as discussed in Sect. 2.3.
By tracing back the individual flight paths of the subgroups of Sco-Cen-Lup and all OB-type stars around them, this work aims to find credible runaway candidates that may have originated in Sco-Cen-Lup. Furthermore, this research is additionally spurred by the recent third data release (Gaia DR3) of the Gaia mission (Gaia Collaboration 2016, 2023; Babusiaux et al. 2023), which offers updated as well as new astrometry, photometry, and spectroscopy data of approximately 1.8 billion sources. For stars with a visual magnitude of 3.6 mag or brighter, data from the HIPPARCOS Catalogue (ESA 1997) was used since these bright stars would saturate the Gaia satellite’s onboard detectors and are thus not included in Gaia’s various data releases.
2. Method
This study focuses on stars within 1.7 kpc of the Sun. Since Sco-Cen-Lup is located roughly at a 115–143 pc distance (Wright & Mamajek 2018), this search radius accounts for regions within as well as around the association. Specifically, 1.7 kpc was chosen because this radius approximately corresponds to the maximum distance a runaway star with a velocity of ∼100 km s−1 (which roughly corresponds to the maximum orbital velocity of very close, very massive binaries) could have covered if it was ejected from the association ∼17 Myr ago (see median ages of US, UCL and LCC in Sect. 1).
2.1. Catalog search: Creating the sample of stars
To create an initial sample, the Gaia DR3 catalog was queried using the advanced search option of ESA’s Gaia Archive1.
In order to not accidentally exclude potentially interesting runaway candidates, minimal constraints were put on objects within the defined search radius:
-
Only Gaia’s third data release catalog was queried.
-
The search radius was defined as a parallax range. All targets should have parallaxes π ≥ 0.588 mas.
-
In order to mostly limit the sample to stars of spectral types O and B, the absolute magnitude of the targets should satisfy the condition MG ≤ 0.65 mag. This limit represents the threshold value between spectral types B and A as cited by Drilling & Landolt (2000).
In order to include as many potential candidates as possible, no further quality criteria were applied at this point; e.g., no constraints were put upon the Renormalized Unit Weight Error (RUWE). In Appendix B, the exact queries posed to the Gaia Archive are listed.
For Criterion 3, the absolute magnitude was defined using the distance modulus
![Mathematical equation: $$ \begin{aligned} M_{\text{G}} = m_{\text{G}} - {5}\,\mathrm{mag}\times \log _{10}(r\,\text{[pc]}) + {5}\,\mathrm{mag} - A_{\text{G}}, \end{aligned} $$](/articles/aa/full_html/2026/04/aa56778-25/aa56778-25-eq5.gif) (1)
(1)
where mG is the apparent magnitude and AG is the extinction parameter.
Criterion 3 does not completely exclude all spectral types other than O and B due to the fact that giants and supergiants of other spectral types can be equally as bright. This results in a certain contamination of the sample with stars of all spectral types, which will be addressed in Sect. 2.4.
Instead of adding an additional constraint such as a blue-white color index to exclude post-main-sequence giants, we left them in on purpose since they could include young runaway stars.
Querying the Gaia DR3 Archive according to the criteria above returned a sample of 597 052 stars.
For all stars within the search radius that are brighter than mG = 3.6 mag, ESA’s HIPPARCOS catalog was queried using the VizieR Information System (Ochsenbein 1996).
Here, the exact same search radius as described in Criterion 2 was used. This time, a constraint was put upon the apparent magnitude, requiring it to be smaller than or equal to the previously mentioned value of 3.6 mag.
We used the new HIPPARCOS data reduction by van Leeuwen (2007) for those stars, if available; otherwise, we used the ESA data (e.g., for γ Crv and α2 CVn).
This search of the HIPPARCOS catalog added 327 stars to the sample to be analyzed.
2.2. Additional properties of the subgroups of Sco-Cen-Lup
In order to identify potential origins of runaway star candidates as precisely as possible, the extensive studies of the structure of Sco-Cen-Lup by Ratzenböck et al. (2023b) were used as a basis. The first 25 of their identified subgroups are listed in Table A.1, since in this work, only those subgroups directly associated with Sco-Cen-Lup were considered, i.e., the groups with SigMA identification numbers 1–25. Groups that lie adjacent to Sco-Cen-Lup, but are not recognized as members of the association – i.e., groups with SigMA numbers 26–37, which belong to the molecular cloud complexes Pipe, Corona Australis and Chameleon, as well as to the separate North-east group – were excluded from this study.
2.2.1. Subgroup radii
The considered subgroups were approximated to be spherical in shape, which appears reasonable based on the subgroup structures determined by Ratzenböck et al. (2023b) and Ratzenböck et al. (2023a).
In order to determine radii for these groups, distance distributions of member stars were studied for each one of the 25 groups. The individual distances were taken from the VizieR catalog “Sco-Cen cluster information” by Ratzenböck et al. (2023b) and the resulting distributions are shown in Figs. C.1–C.3.
These distributions were approximated as Gaussian. As a measure of the widths of these distributions, i.e., the diameters of the subgroups, the full widths at half maximum (FWHM) of the distributions were employed. The resulting subgroup radii are listed in Table A.1.
In addition to distances, and thus parallaxes, Ratzenböck et al. (2023b) have already determined proper motions in directions of both right ascension and declination for each group (Gaia DR3). They are listed in Table A.1. In order to take the group radius into account when determining whether a runaway candidate and a specific group had a close encounter, the group radii were incorporated into the uncertainties of the parallaxes. Since runaway stars could originate from any point in such a subgroup, for the traceback discussed in Sect. 2.3.2, these new parallax uncertainties that incorporate the group radii were used. The exact values are listed in Table A.1.
It should be noted that defining the subgroup radii as FWHM/2 (see Sect. 2.2.1) indirectly favors those regions of each subgroup that are rather close to the respective subgroup’s center point as possible origin of a runaway or walkaway candidate. However, since these are also expected to be the more densely populated regions (in particular with respect to the more massive stars), they should in fact eject more runaway and walkaway stars than the outskirts of a subgroup. Here, we use the relatively small radii in order to be conservative. Also, mass segregation would be another argument to use the relatively small radii.
2.2.2. Median radial velocities
As will be discussed in Sect. 2.3, in addition to parallaxes and proper motions, radial velocities are needed to calculate the flight paths of each subgroup. Median radial velocities were determined by plotting distributions of the individual radial velocities of the member stars of each group. To obtain these radial velocities of the group members, Gaia DR3 was primarily queried using the group membership lists from Ratzenboeck et al. (2023). For stars that had no radial velocity available in Gaia DR3, the SIMBAD database was queried to supplement the sample. We have verified all values used from SIMBAD as true measurements.
For each group, a radial velocity distribution was studied using this data. These distributions are shown in Figs. D.1–D.3. For the calculation of the traced-back flight path of each group, the resulting median radial velocity was used with the median absolute deviation (MAD) of the corresponding distribution as its margin of error.
The choice of using the median radial velocities with their MAD values as uncertainties for the traceback was made because these quantities are not as strongly affected by outliers as e.g. mean values and standard deviations.
The resulting radial velocities of the subgroups are listed in Table A.1.
2.3. Tracing back of flight paths
The stellar parameters of possible runaway candidates that are required for tracing back their past trajectories, i.e., their positions, parallaxes, proper motions and radial velocities, were primarily taken from Gaia DR3. In the case of bright stars (≤3.6 mag), coordinates, parallaxes and proper motions from the HIPPARCOS catalog (ESA 1997) and radial velocities from the “Extended HIPPARCOS Compilation (XHIP)” by Anderson & Francis (2012) were used. In cases where selected Gaia stars had no radial velocities available in DR3, these missing radial velocities were also retrieved from the XHIP catalog. If neither Gaia DR3 nor XHIP offered a radial velocity, the SIMBAD database (Wenger et al. 2000) was searched for additional sources. This still left 23 666 stars for which no radial velocities could be found. Consequently, these stars had to be excluded from any form of analysis. An additional 13 stars were missing radial velocity values as well; however, these stars could be observed at the University Observatory in Großschwabhausen to obtain radial velocities from their spectra. A detailed analysis of the observational data can be found in Bätz et al. (2025). However, none of these observed stars are runaway or walkaway stars.
For the traceback of the flight paths of the subgroups of Sco-Cen-Lup, the positions, parallaxes, and proper motions from Ratzenböck et al. (2023b) were used, which are listed in Table A.1. Additionally, the radial velocities described in Sect. 2.2.2 were employed, which are listed in Table A.1, as well.
2.3.1. First selection
In order to identify a subsample of the most promising candidates among the total sample, a code was used that calculates flight paths of stars and subgroups in the form of skew lines in a Cartesian, Galactocentric frame. This code runs in the programming language R. As input parameters, this code uses the Galactocentric coordinates X, Y and Z, as well as the Galactocentric velocities U, V and W. These coordinates and velocity components were calculated using the Python package Astropy (see Astropy Collaboration 2013, Astropy Collaboration 2018, and Astropy Collaboration 2022). For its calculations, Astropy uses the following additional parameters:
-
The International Celestial Reference System (ICRS) coordinates of the Galactic center: αGC = 266.4051°, δGC = −28.936175.
-
The solar distance from the Galactic center: dGC = 8.3 kpc.
-
The solar velocity – which the velocity vectors of the stars are corrected for – in the Cartesian, Galactocentric frame:
(U⊙, V⊙, W⊙) = (11.1, 232.24, 7.25) km s−1.
-
The solar height above the Galactic midplane: z⊙ = 27.0 pc.
If the minimum distance between the trajectory of a star and that of a subgroup is ≤18 pc (since 18 pc roughly corresponds to the largest subgroup radius of the sample; see Table A.1) and if that close approach occurred in the past, this star is selected as a runaway candidate.
At this point, this subsample of promising candidates comprises 860 stars.
This code neither takes the Galactic potential into account – which is justified in terms of creating a first selection of stars for a more detailed analysis since relatively short distances are studied – nor does it consider any uncertainties of the input parameters. Thus, the output of this code is only an initial selection that requires further study. Therefore, this selection was then fed into the traceback software described in the next section, which does take the influence of the Galactic potential as well as uncertainties of stellar parameters into account.
2.3.2. Traceback
In order to identify which Sco-Cen-Lup subgroups are the likeliest points of origin for the sample of selected stars as described in the previous section, the traceback code developed by Neuhäuser et al. (2020) was used. This C++ software calculates a star’s past trajectory under the influence of the Galactic potential ϕ by numerically integrating its equation of motion backward in time, where the Galactic potential consists of three additive terms that account for the individual potentials of disk, bulge and halo.
As input parameters, this traceback code uses right ascension and declination as position coordinates of the objects, their parallaxes as well as their radial velocities and their proper motions in directions of right ascension and declination, where it uses the three velocity components to calculate the corresponding three-dimensional velocity. For all stars in the selected sample as well as all 25 subgroups, all of these parameters are fed into the software with uncertainties.
The integration of the orbits in question is done in steps: Here, the trajectories of a selection of stars are compared to those of the 25 subgroups of Sco-Cen-Lup. So, after each integrated step, the separation between star and subgroup is calculated, resulting in a certain minimum separation between the two objects.
For this project, a total number of simulated trajectories per star-subgroup pair of 1000 was chosen. The number of steps for each orbit was set to 50 000 and the step width was set to 1000 yr.
Obviously, in order to be considered a possible runaway candidate that originated in a certain group, the star in question was required to have been located within the group at some point in the past, i.e., the minimum separation between a star and the center point of a subgroup was required to be smaller than, or at least equal to, the radius of that group.
For each star that is run through this code, the software returns the number of calculated encounters with each group out of the given total of 1000 simulated trajectories, as well as the time at which the close approach of star and group occurred and the mean minimum distance between the star and the center of the respective group.
During the Monte Carlo simulation of the trajectories of a star and a subgroup, the code calculates the mean minimum distance between these two objects as follows: For each orbit pair that satisfies the condition that the star in question was located within the analyzed subgroup at some point in time, the difference between the position vector of the star and the position vector of the subgroup at the time of their closest encounter is calculated. Then, the sum of all resulting vectors are divided by their number, i.e., an average position vector is calculated. This is the so-called mean minimum separation vector. It has three components, which all have a certain standard deviation. The length of this mean minimum separation vector is the “mean minimum separation.” Thus, the calculation of the mean minimum separation takes all matching orbits into account instead of e.g. just one “best case.”
2.4. Runaway candidate selection
The traceback code discussed in Sect. 2.3.2 returns a certain number of calculated trajectories that result in close approaches between a star and a subgroup out of a total of 1000 simulated flight paths per star-subgroup pair, as well as at what point in time the encounter between star and group occurred and how close their respective orbits brought them to each other.
While there was no outright velocity threshold placed on the sample of candidates that resulted from the traceback described in Sect. 2.3.2 at this point, i.e., runaway as well as walkaway candidates were accepted, some quality criteria still needed to be imposed on that sample in order to identify the most promising candidates. The criteria we imposed are as follows:
-
Removal of stars with no close encounters: Stars for which the traceback software calculated zero close encounters with any of the subgroups were removed from the sample. Evidently, these stars did not originate from Sco-Cen-Lup.
-
Removal of non-OB-type stars from the sample: As we mentioned in Sect. 2.1, the sample of stars is contaminated with stars of spectral types other than O and B to a certain degree. Thus, the spectral type of each star in the sample was retrieved from the “Catalogue of Stellar Spectral Classifications” by Skiff (2014), where the latest entry was always used. Additionally, the color index GBP − GRP should be smaller than 0.5 mag. Traditionally, runaway stars are OB-type stars. In addition to stars of spectral classes O and B, supergiants and bright giants of any spectral type, i.e., any O-, B-, A-, F-, G-, K-, or M-type star with luminosity class ior ii, were kept in the sample because they could be bonus runaways from Sco-Cen-Lup. Any other stars were subsequently eliminated.
-
Comparison of the time of the calculated star-subgroup encounters and the respective subgroup age: Another obvious requirement is the fact that a certain subgroup can only be the parent cluster of a runaway or walkaway candidate if it has already been existing at the time of the calculated close encounter. Thus, any encounters between stars and groups that happened before the respective group came into existence were removed from the results. For that, the subgroup ages listed in Table A.1 were used and the respective age uncertainties of the clusters were taken into account.
Since this project specifically aims at identifying credible stars that probably have their origin in Sco-Cen-Lup, a certain threshold value needs to be placed upon the number of star-subgroup encounters calculated by the traceback code. In order to establish that threshold, the distribution of calculated encounters of the remaining candidates was studied; see Fig. 1. The mean value of the plotted encounter numbers is 50.8. The threshold value was then placed conservatively at approximately three times that mean value, i.e., at 150 encounters per 1000 orbits. This ensures that the selection of candidates that likely originate from Sco-Cen-Lup stands out significantly from the rest of the sample. The histogram (see Fig. 1) further shows that the number of calculated encounters decreases sharply at first, but then rises slightly again just after the cut at 150 encounters per 1000 orbits, which justifies the identified threshold value.
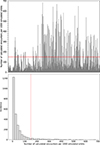 |
Fig. 1. Number of calculated encounters per 1000 simulated orbits of the remaining candidates. Upper panel: Bar chart of the calculated encounters of every star-subgroup pair. Lower panel: Histogram displaying how often a certain number of encounters occurs in the sample. The identified threshold of 150 encounters per 1000 simulated orbits is indicated by a dashed red line. |
After applying the criteria detailed in this section, 97 stars remained in the sample. For these, we have then performed many more traceback calculations, namely 300 000 per runaway-subgroup pair. Out of these, eight runaway candidates and 22 walkaway candidates were selected for their velocities (see Sect. 3).
3. Results
Out of the remaining 97 stars, eight runaway candidates and 22 walkaway candidates were selected to be presented here as follows: A runaway velocity threshold of 20 km s−1 was adopted (see also Sect. 1), where the three-dimensional velocities vpec,3D of the runaway and walkaway candidates were calculated in a Cartesian, Galactocentric frame and in relation to the velocities of the respective subgroups they encountered, i.e.,
 (2)
(2)
If vpec,3D of a candidate reached or exceeded 20 km s−1 with respect to at least one subgroup, this star was counted as a runaway candidate. Stars with 10 km s−1 ≤ vpec,3D < 20 km s−1 with respect to at least one subgroup were counted as walkaway candidates.
3.1. Identified runaway candidates
Table 1 lists the identified runaway candidates along with their close encounters with Sco-Cen-Lup’s subgroups as calculated by the traceback code (see Sect. 2.3.2). Each subgroup is identified by the SigMA numbers defined by Ratzenböck et al. (2023b) and listed along with its age (Ratzenböck et al. 2023a) for reference. Further, the table shows the number of calculated close encounters per 1000 simulated orbits (Nenc) for each star-subgroup pair, as well as the corresponding mean minimum distance ( ) between the star and the center point of the respective subgroup and how long ago these approaches occurred (
 ). The three-dimensional peculiar velocity (vpec,3D) of each star with respect to the respective encountered subgroup was calculated with Eq. (2). The Galactocentric velocity components U, V and W of each candidate as well as each subgroup are listed in Appendix G. Additionally, each candidate is provided with a flag that indicates whether it is a known runaway star, where the following references were checked: the catalog “Young runaway stars within 3 kpc” by Tetzlaff et al. (2011), which lists runaway candidates, as well as Hoogerwerf et al. (2001), Mdzinarishvili (2004), Mdzinarishvili & Chargeishvili (2005), Maíz Apellániz et al. (2018), and Carretero-Castrillo et al. (2023). Since the BSS and DES occur on different timescales (see Sect. 1), Table 1 also includes a flag that indicates which scenario is the likeliest for each star-subgroup pair.
Runaway stars according to the traced-back flight paths.
Note that all of the runaway candidates are now outside their suggested subgroups of origin, which would indeed be expected for runaways.
In a future study, we will trace back these new runaway stars together with all known young neutron stars (with known distance, age and proper motion) and all known young associations (as in Neuhäuser et al. 2020) in order to find cases in which a runaway and a neutron star used to be at the same location inside a young association at the same time, which would then be evidence of a supernova in a binary star.
There are three candidates in the sample that are significantly faster than the other stars; they are shown separately in Table E.1. In all three cases, the extremely high three-dimensional space velocity mainly stems from a noticeably large radial velocity; see also Appendix F.2.
Not much appears to be known about these three stars; apparently, Gaia DR3 4096398244806369792 and Gaia DR3 4111239113458529152 even were completely unknown prior to Gaia’s third data release. In addition to their questionably high velocities, these two stars are also significant outliers on the color-magnitude diagram compared to the other runaway and walkaway candidates as well as members of Sco-Cen-Lup (see Sect. 3.7); they do not satisfy GBP − GRP < 0.5 mag, as Criterion 2 in Sect. 2.4 dictates. Also, extinction values are noticeably large for these two stars (see Appendix H). However, the third star of questionable runaway status (Cl* NGC 2264 VAS 133) fits well on the color-magnitude diagram.
Although runaway velocities as high as those of the stars presented in Table E.1 are not necessarily impossible, in extreme cases such as these, it cannot be ruled out that the respective radial velocity measurement is incorrect and that the velocities displayed here are subsequently inaccurate. Indeed, for all three stars, the Gaia data are problematic.
Gaia DR3 4096398244806369792: The quality of the astrometric solution is poor (RUWE = 7.500). Double peaks in 28% of the scans indicate binarity with a separation below 0.5 arcsec. The median radial velocity is based on only three epochs over a period of 882 days and has a large uncertainty. In two of the epochs, the spectra had to be deblended to eliminate contamination from a nearby source. In sum, the reported radial velocity is dubious.
Gaia DR3 4111239113458529152: The excess noise is statistically significant (D = 5). Double peaks in 19% of the scans hint at binarity. The very large radial velocity is based on six epochs taken over 463 days, of which five epochs had to be deblended. Again, the radial velocity may not be very credible.
Cl* NGC 2264 VAS 133, i.e., star VAS 133 in the cluster NGC 2264: Here, the data could well be affected by crowded field problems due to the many other stars of the cluster. In the Washington Visual Double Star Catalog (WDS; Mason et al. 2001), many visual companion candidates are listed.
Since all this evidence reinforces the assumption that the radial velocities of these three stars may be incorrect, they should not be regarded as good runaway candidates until more research is conducted.
3.2. Identified walkaway candidates
In addition, we found 22 walkaway star candidates, which were possibly ejected with velocities ranging from 10 to 20 km s−1 from the subgroups in Sco-Cen-Lup. Since they are all still inside one of those subgroups, we consider them as candidates, but they are less credible than the runaway stars in Table 1.
These are the walkaway candidates: HD 97583, HD 101189, HD 150742, HD 146905, HD 146954, HD 140285 A, HD 149886, HD 145792, HD 108250, HD 107696, HD 110506, H Cen, HD 126759, HD 126135, HD 144844, ν Sco A, δ Cen, β Cru, ϵ Cen, τ Sco, i Sco, and ζ Cen.
3.3. A note on excluded candidates
With the nominal (and relatively high) radial velocity values of HD 66778 and HD 44354 from the SIMBAD database, they can also be traced back to SigMA groups, but their radial velocities from APOGEE-2-DR17 (Abdurro’uf et al. 2022) and LAMOST (Cui et al. 2012) are different (they are probably spectroscopic binaries). Therefore, we do not include them as runaways or walkaways here.
3.4. Random pairing
For each pairing of a runaway star and suggested subgroup listed in Table 1, we specify the number of stars in that subgroup and the number of traceback runs with close encounters in the past. These two parameters are needed to judge the credibility of the suggested pairing.
In addition to the traceback with the measured astrometric parameters (and the radial velocity) of the stars and subgroups, we have then also performed further simulated tracebacks with random input data:
A natural question arises: Are the observed close encounters between runaway candidate stars and stellar groups statistically significant or are they merely coincidental? To address this, we analyzed the 3D velocity vector directions as a probe of candidate randomness. The orientation of velocity components (velocity cones in 3D space) is crucial in determining the likelihood of successful traceback encounters.
To quantify the reliability, we performed traceback calculations with partly random input data: we maintained the absolute velocity, but assigned velocity components with random directions. We randomly sampled the values for position, proper motion, parallax, and radial velocity, using the mean values and covariance matrices of each runaway candidate star and stellar group through Monte Carlo simulations, where we ran a total of 300 000 simulations per star-subgroup pair. Next, we generated random directions of the 3D velocity of these vectors by drawing uniform random values of two angles, φ from 0 to π and θ from 0 to 2π. They can be considered as the co-latitude of a sphere and the longitude in order to cover all possible directions in 3D.
If the number of successful traceback runs in this randomized dataset closely matches with the observed cases, the star-subgroup pair might not be real, but instead, this result could have been produced by chance. In contrast, if the observed number of encounters is much greater than that number of randomized cases, this indicates that our results are statistically acceptable, i.e., that the considered runaway star and the stellar group were at the same place at the same time in the past (see second-to-last column in Table 1).
Note that the approach mentioned above corresponds to a pessimistic case of the problem, i.e., randomizing purely the directions of the 3D velocity vectors of a runaway candidate star and a parental stellar group.
Then, we again traced back the stars and the subgroups to estimate the number of random close encounters in 300 000 simulated orbits.
In Table 1, we list the ratio between the number of true close encounters and the number of random pairings (Penc/Prnd). The larger this number, the more likely it is that this star indeed originated in that subgroup.
However, as mentioned, the number of member stars in the subgroups and the number of close encounters also have to be taken into account when judging the credibility of the pair.
3.5. A note on multiplicity of runaway stars
Both runaway and walkaway stars are expected to be single stars in most cases. For example, in a DES of μ Col, ι Ori, and AE Aur from Orion (Hoogerwerf et al. 2000, 2001), the two single stars μ Col and AE Aur have high velocities, whereas the low-velocity star ι Ori is a multiple star (Heyne et al. 2020).
Supernova ejection preferentially unbinds single or very close binary stars. If a supernova happens in a hierarchical triple and if the most massive star that is to go supernova has a significantly larger separation from the orbiting close binary at the time of the supernova, the close binary can be ejected. This close binary would preferentially be observable as a spectroscopic binary. Wide visual binaries are not expected among runaways.
However, in order to be unbiased and in spite of these expectations, we did not exclude any stars from the analysis a priori. Actually, most OB-type stars are multiple stars.
For all the credible runaway and walkaway stars found here (see Table 1 and Sect. 3.2), we have then a posteriori studied their multiplicity from the literature: Among the eight runaway stars, only four have entries in the WDS (Mason et al. 2001). For these four runaway stars with WDS entries (γ Crv, α2 CVn, β Lib and 66 Eri), we find that their WDS companions all have projected separations of more than 50 au, i.e., very wide. Additionally, the walkaway candidate ζ Cen and the runaway candidate HD 160093 are also listed as possible spectroscopic binaries in SIMBAD (see Chini et al. 2012 and Kılıçoğlu et al. 2016, respectively). In the case of ζ Cen, it should be noted that while the radial velocity measurements since the 1940s always give 6.5 km s−1, there are two deviations from 1914 and 1928, each having larger uncertainties.
In the case of HD 160093, Kılıçoğlu et al. (2016) found it to be a spectroscopic binary and a member of the M6 open cluster; these findings make it less likely that this star is a runaway from SigMA 10.
We can still consider most of our runaway candidates as likely single stars or wide binaries.
3.6. A note on the identification of the likeliest parent subgroups and the case of ζ Oph
For most of the runaway and walkaway stars found in this study (Table 1), we found and list more than just one subgroup from which the respective star may have been ejected. One can decide which is the most credible solution by using the following criteria:
-
The flight time since the runaway candidate left the subgroup must not be larger than the subgroup age.
-
The larger the number of close encounters, the more likely the solution.
-
The larger the fraction of true close encounters to random close encounters (also listed in Table 1), the more likely the solution.
-
In the case of a DES, the difference between flight time and subgroup age must not be larger than approximately 4 Myr.
-
In the case of a BSS, the difference between flight time and subgroup age must be larger than approximately 3 Myr (first possible supernova after star formation).
-
The larger the number of stars in the subgroup, the more likely the solution.
-
In the case of a BSS, the initial mass function of the subgroup must allow for at least one supernova. In particular, the runaway candidate must not be much more massive or much brighter than the most massive star currently residing in the subgroup. This can be checked in the Hertzsprung-Russell diagrams in Appendix J. If the runaway star is among or near the most massive stars (i.e., among the brightest stars of the subgroup) and if the brightest stars in the subgroup (including the runaway candidate) are at least as bright as MG = −1.2 mag (which corresponds to the absolute brightness of B3vstars as per www.pas.rochester.edu/~emamajek/EEM_dwarf_UBVIJHK_colors_Teff.txt), then supernovae were possible. Effectively, we need at least roughly 270 stars in a subgroup to allow for at least one supernova (see Kroupa 2001). However, it is worth mentioning that, in some cases, a phase of mass transfer in a binary system may increase the mass of the mass gainer to a mass higher than 8 M⊙.
All criteria together decide whether a scenario is likely and, if there were several possible solutions, which ones are more credible. In some cases, after its original ejection from one of the subgroups, the respective runaway star may also have flown through one or more of the other subgroups.
There are only two cases where these numbers tend to favor one of the different solutions listed in Table 1, namely: λ CMa from SigMA 21 and 66 Eri from SigMA 14. The case of γ Crv is more complex: The high number of stars in SigMA 15 would prefer this solution as BSS, but for a dynamical ejection, one may not need that many stars, so that SigMA 13 with a high true-to-random close encounter ratio may also instead be the correct solution, here as DES.
We explain the procedure with ζ Oph as an example (last star in Table 1). The flight path of this runaway star can cross the subgroups SigMA 9, 15, 19, 20, and 21, depending on when it was ejected (see Fig. I.1). For example, if it were ejected from SigMA 21 in LCC, it would then have flown through the other subgroups to reach its current location. Or, on the other extreme, if it originated from SigMA 9 in US, it would not have flown through any of the other subgroups. However, in the latter case, the origin from SigMA 9 can be excluded due to the low number of stars in SigMA 9 (276), and hence its initial mass function. It is improbable that two supernova progenitors have formed in SigMA 9 (i.e., its current most massive star is too low in mass; Fig. J.2), as two sufficiently massive supernova progenitors are needed for the pre-supernova binary that ejected both a neutron star and ζ Oph as a runaway star, which as an O9.2ivstar is also a supernova progenitor. The same holds for SigMA 19 (246 stars). In Fig. I.1, we include SigMA 9 as an example of a subgroup through which a runaway star can fly after the ejection in a different subgroup, but we leave out SigMA 19 (and 20) for clarity. Without SigMA 9 and 19 (too low in mass), we are then left with SigMA 15 in UCL and SigMA 20 and 21 in LCC. Figure I.1, however, includes SigMA 9, 15, and 21 to show the concept that even if the origin would be in SigMA 15, the flight path also crosses SigMA 9 and 21. The case of SigMA 19 with only 246 stars but a relatively large ratio of true-to-random encounters (Table 1) shows that this criterion alone would be problematic. If ζ Oph originated from, for example, SigMA 15, an extrapolation of its current flight path beyond its origin would lead through SigMA 19 (as well as 20 and 21). Indeed, the respective flight time listed in Table 1 for each scenario for ζ Oph is the shortest for SigMA 9 in US, and it is longer for those subgroups that are located farther away from the current position of ζ Oph. That is, the listed flight time is largest for SigMA 19, 20, and 21 in LCC. Additionally, with larger flight times, the uncertainties in traceback calculations increase, as well. SigMA 9 is the oldest subgroup of Upper Scorpius and has a similar age as SigMA 15; these two groups are located next to each other on sky.
The seven criteria listed above are therefore still not sufficient to decide which is the correct scenario. In order to determine the true flight path and true origin, one would have to find either other runaway stars, which were at the same time at the same place (DES), or a neutron star, which may have been at the same time at the same place (BSS). This was done, e.g., in Neuhäuser et al. (2020) based on HIPPARCOS data, where they found ζ Oph together with the radio pulsar PSR B1706-16 to have originated in a binary supernova that occurred in UCL (1.78 ± 0.21) Myr ago. Figure I.1 is an adapted version of Fig. 2 in Neuhäuser et al. (2020). It shows the closest approach of ζ Oph and the pulsar PSR B1706-16 as well as their flight paths since their encounter.
In our Fig. I.1 we have added the subgroups 9 (US), 15 (UCL), and 21 (LCC) with their current location (right, dotted circles) and their respective location in the past at the time of the closest encounter with ζ Oph (left, full circles) together with the flight path of the center of the subgroups for the respective time spans. In principle, SigMA 15 in UCL is consistent with the earlier results from Neuhäuser et al. (2020): The flight time of ζ Oph (1.60 ± 0.14) Myr from SigMA 15 (Table 1, for the closest approach between runaway and subgroup center) is consistent with both approximately 1.58 Myr (closest approach) and (1.78 ± 0.21) Myr (median of all 117 best, closest cases) from Neuhäuser et al. (2020) for UCL. The median of the distances used as input in the traceback run that led to close approaches of ζ Oph with SigMA 15 is (99.6 ± 12.7) pc, which is also consistent with (107 ± 4) pc (UCL; Neuhäuser et al. 2020).
While it would have been beyond the scope of this study to trace back all known neutron stars with sufficiently known properties (i.e., distances and proper motions) together with all 25 SigMA subgroups and all our eight runaway stars (future publication), we have done such calculations for ζ Oph to show the principle.
We used the properties of ζ Oph (too bright for Gaia) from HIPPARCOS (van Leeuwen 2007) as in Neuhäuser et al. (2020) and our Tables F.1 and G.2, then the subgroups SigMA 9, 15, 19, 20, and 21 with the properties from Table A.1, as well as the neutron star B1706-16 with its known distance and proper motion (as in Neuhäuser et al. 2020). We traced them back through the Galactic potential for 22.5 Myr (which is the oldest possible age of the oldest subgroup; see Table A.1) just as described in Neuhäuser et al. (2020) with 3 million Monte Carlo runs for each combination by varying the neutron star radial velocities following the Hobbs et al. (2005) distribution and the other observables (except the coordinates) within their measurement uncertainties. For the radii of the subgroups, to be conservative, the values in Table A.1 were used, even though they can be seen as lower limits.
Subgroups SigMA 9 and 19 can be excluded anyway because they do not even contain a sufficient number of stars for at least two supernova progenitors that are needed for the pre-supernova binary with ζ Oph. For the other subgroups, the number of close encounters between ζ Oph and pulsar B1706-16 inside the respective subgroup (with a separation of up to 10 pc between runaway and neutron star) was 661, 41, and 171 for subgroups SigMA 15, 20, and 21, respectively. With similar parameters, but random mixing, we also calculated the number of apparent encounters by chance and obtained zero (per 3 million runs) for all three SigMAs. Hence, it is most likely that there was a close encounter between ζ Oph and B1706-16 within SigMA 15, i.e., a supernova in a binary which ejected both (and 60Fe). The closest encounter between ζ Oph and B1706-16 found was within 0.02 pc (0.95 Myr ago), and the mean of all the minimum separations of all 661 cases within 10 pc was just 0.99 pc (all inside SigMA 15). See Fig. 2 for the best case (and all 661 cases within 10 pc). After its ejection from SigMA 15 in UCL, ζ Oph has flown through SigMA 9 in US (Figs. 2 and I.1); SigMA 9 is called “US foreground” in Ratzenböck et al. (2023b). An alternative possibility is an origin of ζ Oph and B1706-16 in SigMA 21, which has approximately four times fewer encounters, but a similar small number of random encounters (small number statistics). Note that, as seen in Fig. I.1, SigMA 15 and 21 did overlap in space some 1.5 Myr ago. SigMA 15 is more likely as supernova location, also because there is a cavity in the interstellar medium density (so-called hotspot 2 in Capitanio et al. 2017), which was at l = −16° ±6° and b = 20° ±6° some 1.5 Myr (Neuhäuser et al. 2020), which is consistent with SigMA 15, but not with SigMA 21; see also Fig. I.1.
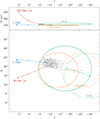 |
Fig. 2. Close approaches of PSR B1706-16 and ζ Oph in SigMA 15. Lower panel: Flight paths (colored lines) for the closest approach of PSR B1706-16 and ζ Oph (best case) projected on the sky (Galactic longitude l versus Galactic latitude b at epoch of date). The paths start at their current positions (left) and are subsequently marked by small crosses after every 0.5 Myr of flight time. They end at the closest approach within 0.1 pc of each other 1.5 Myr before present (center). SigMA 15 is shown with an orange circle both 1.5 Myr ago (full line) and now (dashed). The gray dots show the 661 closest approaches of PSR B1706-16 and SigMA 15 (i.e., within 10 pc of each other). Upper panel: Distance, D, versus Galactic longitude, l, for the past flight paths. UCL’s position some 1.5 Myr ago is shown as a full green circle, and its current location is represented by the dotted green circle. These are for the best case in Neuhäuser et al. (2020). |
In sum, we found that the runaway star ζ Oph and the pulsar B1706-16 were ejected from SigMA 15 inside UCL by a supernova at a distance of 100.0 ± 5.2 pc 1.45 ± 0.21 Myr ago. These values are consistent with the earlier results in Neuhäuser et al. (2020) for UCL as a whole: supernova at a distance of 107 ± 4 pc 1.78 ± 0.21 Myr ago. This supernova may well have contributed to the approximately two-million-year-old 60Fe found in the Earth’s crust (Wallner et al. 2016). The evolution of ζ Oph and the supernova progenitor were later studied in more detail by Renzo & Götberg (2021).
Thus, our work in this project has helped confirm the result that ζ Oph has its origin in UCL, as found by Neuhäuser et al. (2020). On the basis of Sco-Cen-Lup’s substructuring, as determined by Ratzenböck et al. (2023b), we could somewhat refine the results from Neuhäuser et al. (2020). According to our results, SigMA 15, which is part of UCL, is the likeliest point of origin of this runaway star.
To identify the true place of origin of the other runaway stars, further traceback studies are needed. Studies simultaneously tracing back the flight paths of these new runaways, all neutron stars with sufficient astrometric parameters, and the Sco-Cen-Lup subgroups would be of interest. For DES runaway candidates, studies would have to trace them back simultaneously with other known runaways and the respective subgroups.
3.7. Color-magnitude diagrams
In order to test how likely it is for each identified runaway candidate that it indeed used to be part of Sco-Cen-Lup, the respective positions of the candidates on the color-magnitude diagram (CMD) can be compared to those of recognized members of the association. Thus, it can be determined if they fit the overall distribution of Sco-Cen-Lup members on the CMD or if they are significant outliers.
Such a CMD is shown in Fig. 3. For the Sco-Cen-Lup members indicated by the blue symbols in the plot, the membership lists of all 25 analyzed subgroups provided by Ratzenboeck et al. (2023) were used to obtain parallaxes, apparent magnitudes and extinction parameters from Gaia DR3, from which the absolute magnitudes were calculated using Eq. (1). Obviously, only those association members for which all of these parameters are available in Gaia DR3 are plotted. The plotted data for the identified runaway candidates is listed in Appendix H.
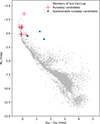 |
Fig. 3. Member stars of Sco-Cen-Lup (small gray dots), the identified runaway candidates (red crosses), and the three questionable runaway candidates (large blue dots; see Sect. 3.1) on the color-magnitude diagram. |
As expected from their spectral type, the identified candidates are among the hottest and brightest stars plotted. The identified candidates overall fit well with the members of Sco-Cen-Lup; most are distributed rather narrowly, which might suggest that the runaway candidates are similar in age to the members of Sco-Cen-Lup and have indeed formed within the association. There are, however, two runaway candidates with color indices GBP − GRP > 1 whose positions on the CMD consequently deviate more strongly from that of the others.
As discussed in Sect. 3.1, these outliers are stars of already questionable runaway status.
In Appendix J, a CMD for each individual subgroup is shown along with the identified runaway candidates they are possibly the parent cluster of (see Table 1). Obviously, for many candidates, the traceback code has calculated encounters with multiple groups. However, on the bright end of the CMDs, group members as well as most runaway candidates are distributed very narrowly. Thus, it is not directly possible to find just one most likely parent cluster for candidates with multiple encounters from studying the CMDs as in Appendix J.
3.8. Comparison with previous work
We compared our work to previous similar studies, such as Hoogerwerf et al. (2000) and Hoogerwerf et al. (2001), whose authors compiled runaway stars (and neutron stars) and traced them back to find their places of origin in either a dynamical or supernova ejection. For a possible origin in Sco-Cen-Lup, they list the following five runaway stars: HD 88661, j Cen, V716 Cen, κ1 Aps and ζ Oph.
As mentioned, ζ Oph is also a runaway star likely originating from Sco-Cen-Lup according to our work.
Among the others, we found j Cen to originate from α Cen (SigMA 21) but did not accept it as either a runaway or walkaway star, since its peculiar velocity with respect to that group was only 6.14 km s−1. However, we did not wish to completely neglect to mention j Cen, since its space velocity – though low – may still exceed the escape velocity of its parent cluster.
The three others do not originate from subgroups SigMA 1–25 according to the new Gaia astrometry and/or current radial velocities: we used 31.0 ± 3.0 km s−1 for HD 88661 (Thackeray et al. 1973), −10.3 ± 6.9 km s−1 for V716 Cen (Bakış et al. 2008), and 16.5 ± 5.0 km s−1 for κ1 Aps (Jilinski et al. 2010).
The additional runaway stars found in our study should be taken into account in future studies on the present mass functions in Sco-Cen-Lup or its subgroups, for example by comparison with the initial mass function to conclude on the number and properties of previous supernovae (as, e.g., in Breitschwerdt et al. 2016 and Schulreich et al. 2023).
4. Conclusion
This work aimed at identifying new runaway stars ejected from the closest OB association, Scorpius-Centaurus-Lupus. Using software introduced in Neuhäuser et al. (2020) and data from Gaia and HIPPARCOS, we traced back in time the flight paths of all known OB-type stars within a radius of 1.7 kpc around the Sun and those of the subgroups of Sco-Cen-Lup in order to find close encounters between runaway candidates and subgroups and thus the potential parent cluster of each runaway candidate. We confirmed that our calculated close encounters of each star-subgroup pair are statistically significant and could not have just been produced by random chance. Additionally, we adopted a runaway velocity threshold of 20 km s−1 for the three-dimensional velocity of the star with respect to the subgroup it might have been ejected from. Stars with velocities ranging from 10 to 20 km s−1 were accepted as walkaway candidates (i.e., “slower” runaway stars that were ejected from their parent group by the same mechanisms as their faster counterparts).
Thus, we were able to identify the following eight runaway stars: λ CMa, HD 160093, 66 Eri, γ Gru, γ Crv, α2 CVn, β Lib, and ζ Oph. Out of these, γ Gru, γ Crv, and ζ Oph were previously known as runaway stars. We also identified 22 walkaway candidates.
For all identified runaway stars, we checked whether their position on the color-magnitude diagram matches the positions of the member stars of the suggested parent subgroup, which, if comparable, would suggest that the runaway star and the subgroup members follow a similar evolutionary path. This further substantiates the possibility of the runaway star indeed originating from the suggested group.
Out of all our identified runaway stars, up to two might have been ejected dynamically from their parent cluster. However, the majority of our runaway stars are more likely to have been produced in a binary-supernova scenario. With these findings, we hope to contribute to the statistics of how often each scenario occurs in nature.
Among the previously known runaway stars that have also been identified as such in this work is ζ Oph. Neuhäuser et al. (2020) found that this star was ejected in a BSS from a location within UCL 1.78 ± 0.21 Myr ago, and they also identified the pulsar B1706-16 as the former companion of ζ Oph. In our study, we identified SigMA 15 as the likeliest parent cluster of ζ Oph and PSR B1706-16, which is indeed one of the richest subgroups within UCL. According to our methods, the ejection of ζ Oph occurred 1.45 ± 0.21 Myr ago. Thus, we were able to confirm and further refine the results from Neuhäuser et al. (2020).
Further studies are possible to investigate runaway stars originating from Sco-Cen-Lup. For example, one could run traceback simulations of the runaway stars identified in this work together with all known neutron stars in order to potentially find the former companion of a runaway star produced in a BSS, akin to the case of ζ Oph and PSR B1706-16.
Acknowledgments
We are very grateful to Frank Gießler (Friedrich-Schiller-University Jena) for the opportunity to use his C++ traceback code and for his comments on an earlier version of this manuscript. He also performed the pulsar traceback calculations and prepared Figs. 2 and I.1. We are grateful to Laura Posch, João Alves, and Sebastian Ratzenböck (U Vienna) for discussion on star formation in Sco-Cen-Lup. We thank Markus Mugrauer and Baha Dinçel (U Jena) for information on HD 66778 and HD 44354. We thank Guillermo Torres (CfA Harvard) for comments on two of the problematic stars with unusually high radial velocities. VVH and RN would like to thank the Deutsche Forschungsgemeinschaft for financial support in grant numbers NE 515/61-1 and 65-1. VVH and LAH acknowledge support by the Yerevan State University in the framework of an internal grant. This work was supported by the Higher Education and Science Committee of MESCS RA No 22RL-039. This work has made use of data from the European Space Agency (ESA) mission Gaia (https://www.cosmos.esa.int/gaia), processed by the Gaia Data Processing and Analysis Consortium (DPAC, https://www.cosmos.esa.int/web/gaia/dpac/consortium). Funding for the DPAC has been provided by national institutions, in particular the institutions participating in the Gaia Multilateral Agreement. This research has made use of the SIMBAD database, operated at CDS, Strasbourg, France. This research has made use of the VizieR catalog access tool, CDS, Strasbourg, France (Ochsenbein 1996). The original description of the VizieR service was published in Ochsenbein et al. (2000). We used the LAMOST data archive: The Guoshoujing Telescope (the Large Sky Area Multi-Object Fiber Spectroscopic Telescope, LAMOST) is a National Major Scientific Project built by the Chinese Academy of Sciences; funding for the project has been provided by the National Development and Reform Commission; LAMOST is operated and managed by the National Astronomical Observatories, Chinese Academy of Sciences. This work made use of Astropy (http://www.astropy.org): a community-developed core Python package and an ecosystem of tools and resources for astronomy (Astropy Collaboration 2013, 2018, 2022).
References
- Abdurro’uf, Accetta, K., Aerts, C., et al. 2022, ApJS, 259, 35 [NASA ADS] [CrossRef] [Google Scholar]
- Anderson, E., & Francis, C. 2012, Astron. Lett., 38, 331 [Google Scholar]
- Astropy Collaboration (Robitaille, T. P., et al.) 2013, A&A, 558, A33 [NASA ADS] [CrossRef] [EDP Sciences] [Google Scholar]
- Astropy Collaboration (Price-Whelan, A. M., et al.) 2018, AJ, 156, 123 [Google Scholar]
- Astropy Collaboration (Price-Whelan, A. M., et al.) 2022, ApJ, 935, 167 [NASA ADS] [CrossRef] [Google Scholar]
- Babusiaux, C., Fabricius, C., Khanna, S., et al. 2023, A&A, 674, A32 [NASA ADS] [CrossRef] [EDP Sciences] [Google Scholar]
- Bakış, H., Bakış, V., Demircan, O., & Eker, Z. 2008, MNRAS, 385, 381 [CrossRef] [Google Scholar]
- Bätz, J., Mugrauer, M., Michel, K.-U., et al. 2025, AN [Google Scholar]
- Blaauw, A. 1946, Publ. Kapteyn Astron. Lab. Gron., 52, 1 [Google Scholar]
- Blaauw, A. 1961, Bull. Astron. Inst. Netherlands, 15, 265 [NASA ADS] [Google Scholar]
- Breitschwerdt, D., Feige, J., Schulreich, M. M., et al. 2016, Nature, 532, 73 [NASA ADS] [CrossRef] [Google Scholar]
- Capitanio, L., Lallement, R., Vergely, J. L., Elyajouri, M., & Monreal-Ibero, A. 2017, A&A, 606, A65 [NASA ADS] [CrossRef] [EDP Sciences] [Google Scholar]
- Carretero-Castrillo, M., Ribó, M., & Paredes, J. M. 2023, A&A, 679, A109 [NASA ADS] [CrossRef] [EDP Sciences] [Google Scholar]
- Chini, R., Hoffmeister, V. H., Nasseri, A., Stahl, O., & Zinnecker, H. 2012, MNRAS, 424, 1925 [Google Scholar]
- Cui, X.-Q., Zhao, Y.-H., Chu, Y.-Q., et al. 2012, Res. Astron. Astrophys., 12, 1197 [Google Scholar]
- de Mink, S. E., Brott, I., Cantiello, M., et al. 2012, in Proceedings of a Scientific Meeting in Honor of Anthony F. J. Moffat, eds. L. Drissen, C. Robert, N. St-Louis, & A. F. J. Moffat, ASP Conf. Ser., 465, 65 [NASA ADS] [Google Scholar]
- de Zeeuw, P. T., Hoogerwerf, R., de Bruijne, J. H. J., Brown, A. G. A., & Blaauw, A. 1999, AJ, 117, 354 [Google Scholar]
- Dinçel, B., Neuhäuser, R., Yerli, S. K., et al. 2015, MNRAS, 448, 3196 [CrossRef] [Google Scholar]
- Drilling, J. S., & Landolt, A. U. 2000, in Allen’s Astrophysical Quantities, ed. A. N. Cox, 4th edn (New York, NY 10010, USA: AIP Press. Springer-Verlag), 388 [Google Scholar]
- Ekström, S., Georgy, C., Eggenberger, P., et al. 2012, A&A, 537, A146 [Google Scholar]
- ESA. 1997, in The HIPPARCOS and TYCHO Catalogues. Astrometric and Photometric Star Catalogues Derived from the ESA HIPPARCOS Space Astrometry Mission, ESA SP, 1200 [Google Scholar]
- Frinchaboy, P. M., & Majewski, S. R. 2008, AJ, 136, 118 [NASA ADS] [CrossRef] [Google Scholar]
- Gaia Collaboration (Prusti, T., et al.) 2016, A&A, 595, A1 [NASA ADS] [CrossRef] [EDP Sciences] [Google Scholar]
- Gaia Collaboration (Vallenari, A., et al.) 2023, A&A, 674, A1 [NASA ADS] [CrossRef] [EDP Sciences] [Google Scholar]
- Ghazaryan, S., Alecian, G., & Hakobyan, A. A. 2018, VizieR On-line Data Catalog: J/MNRAS/480/2953 [Google Scholar]
- Gies, D. R., & Bolton, C. T. 1986, ApJS, 61, 419 [Google Scholar]
- Gontcharov, G. A. 2012, Astron. Lett., 38, 694 [CrossRef] [Google Scholar]
- Heyne, T., Mugrauer, M., Bischoff, R., et al. 2020, AN, 341, 645 [Google Scholar]
- Hobbs, G., Lorimer, D. R., Lyne, A. G., & Kramer, M. 2005, MNRAS, 360, 974 [Google Scholar]
- Hoogerwerf, R., de Bruijne, J. H. J., & de Zeeuw, P. T. 2000, ApJ, 544, L133 [NASA ADS] [CrossRef] [Google Scholar]
- Hoogerwerf, R., de Bruijne, J. H. J., & de Zeeuw, P. T. 2001, A&A, 365, 49 [NASA ADS] [CrossRef] [EDP Sciences] [Google Scholar]
- Hourihane, A., Francois, P., Worley, C. C., et al. 2023, VizieR On-line Data Catalog: J/A+A/676/A129 [Google Scholar]
- Janka, H. T., & Mueller, E. 1994, A&A, 290, 496 [NASA ADS] [Google Scholar]
- Jilinski, E., Ortega, V. G., Drake, N. A., & de la Reza, R. 2010, ApJ, 721, 469 [NASA ADS] [CrossRef] [Google Scholar]
- Jönsson, H., Holtzman, J. A., Allende Prieto, C., et al. 2020, AJ, 160, 120 [Google Scholar]
- Kılıçoğlu, T., Monier, R., Richer, J., Fossati, L., & Albayrak, B. 2016, AJ, 151, 49 [CrossRef] [Google Scholar]
- Kroupa, P. 2001, MNRAS, 322, 231 [NASA ADS] [CrossRef] [Google Scholar]
- Lai, D. 2003, in Radio Pulsars, eds. M. Bailes, D. J. Nice, & S. E. Thorsett, ASP Conf. Ser., 302, 307 [Google Scholar]
- Maiz Apellaniz, J., & Barba, R. H. 2018, VizieR On-line Data Catalog: J/A+A/613/A9 [Google Scholar]
- Maíz Apellániz, J., Pantaleoni González, M., Barbá, R. H., et al. 2018, A&A, 616, A149 [NASA ADS] [CrossRef] [EDP Sciences] [Google Scholar]
- Mason, B. D., Wycoff, G. L., Hartkopf, W. I., Douglass, G. G., & Worley, C. E. 2001, AJ, 122, 3466 [Google Scholar]
- Mdzinarishvili, T. G. 2004, Astrophysics, 47, 155 [NASA ADS] [CrossRef] [Google Scholar]
- Mdzinarishvili, T. G., & Chargeishvili, K. B. 2005, A&A, 431, L1 [NASA ADS] [CrossRef] [EDP Sciences] [Google Scholar]
- Neuhäuser, R., Gießler, F., & Hambaryan, V. V. 2020, MNRAS, 498, 899 [CrossRef] [Google Scholar]
- Ochsenbein, F. 1996, The VizieR Database of Astronomical Catalogues [Google Scholar]
- Ochsenbein, F., Bauer, P., & Marcout, J. 2000, A&AS, 143, 23 [NASA ADS] [CrossRef] [EDP Sciences] [Google Scholar]
- Pecaut, M. J., & Mamajek, E. E. 2016, MNRAS, 461, 794 [Google Scholar]
- Pflamm-Altenburg, J., & Kroupa, P. 2010, MNRAS, 404, 1564 [NASA ADS] [Google Scholar]
- Poveda, A., Ruiz, J., & Allen, C. 1967, BOTT, 4, 86 [Google Scholar]
- Ratzenböck, S., Großschedl, J. E., Alves, J., et al. 2023a, A&A, 678, A71 [NASA ADS] [CrossRef] [EDP Sciences] [Google Scholar]
- Ratzenböck, S., Großschedl, J. E., Möller, T., et al. 2023b, A&A, 677, A59 [NASA ADS] [CrossRef] [EDP Sciences] [Google Scholar]
- Ratzenboeck, S., Grossschedl, J., Moeller, T., et al. 2023, VizieR On-line Data Catalog: J/A+A/677/A59 [Google Scholar]
- Renzo, M., & Götberg, Y. 2021, ApJ, 923, 277 [NASA ADS] [CrossRef] [Google Scholar]
- Renzo, M., Zapartas, E., de Mink, S. E., et al. 2019, A&A, 624, A66 [NASA ADS] [CrossRef] [EDP Sciences] [Google Scholar]
- Schulreich, M. M., Feige, J., & Breitschwerdt, D. 2023, A&A, 680, A39 [NASA ADS] [CrossRef] [EDP Sciences] [Google Scholar]
- Seeds, M., & Backman, D. 2009, Astronomy: The Solar System and Beyond (Cengage Learning) [Google Scholar]
- Skiff, B. A. 2014, VizieR On-line Data Catalog: B/mk [Google Scholar]
- Stone, R. C. 1979, ApJ, 232, 520 [NASA ADS] [CrossRef] [Google Scholar]
- Stoop, M., de Koter, A., Kaper, L., et al. 2024, Nature, 634, 809 [Google Scholar]
- Tetzlaff, N., Neuhäuser, R., & Hohle, M. M. 2011, MNRAS, 410, 190 [Google Scholar]
- Thackeray, A. D., Tritton, S. B., & Walker, E. N. 1973, MmRAS, 77, 199 [NASA ADS] [Google Scholar]
- van der Meij, V., Guo, D., Kaper, L., & Renzo, M. 2021, A&A, 655, A31 [NASA ADS] [CrossRef] [EDP Sciences] [Google Scholar]
- van Leeuwen, F. 2007, A&A, 474, 653 [CrossRef] [EDP Sciences] [Google Scholar]
- van Leeuwen, F., de Bruijne, J., Babusiaux, C., et al. 2022, Gaia DR3 Documentation, European Space Agency; Gaia Data Processing and Analysis Consortium. Online at https://gea.esac.esa.int/archive/documentation/GDR3/index.html, id. 1 [Google Scholar]
- Wallner, A., Feige, J., Kinoshita, N., et al. 2016, Nature, 532, 69 [NASA ADS] [CrossRef] [Google Scholar]
- Wenger, M., Ochsenbein, F., Egret, D., et al. 2000, A&AS, 143, 9 [NASA ADS] [CrossRef] [EDP Sciences] [Google Scholar]
- Wischnewski, E. 2022, Johnson B und B–V aus Gaia-Helligkeiten berechnen, online: https://www.bav-astro.de/Rundbriefe/RB2022-3/171.pdf. Website accessed: 2024-11-18 [Google Scholar]
- Wright, N. J., & Mamajek, E. E. 2018, MNRAS, 476, 381 [Google Scholar]
- Zehe, T., Mugrauer, M., Neuhäuser, R., et al. 2018, AN, 339, 46 [Google Scholar]
- Zwicky, F. 1957, Morphological Astronomy [Google Scholar]
ESA’s Gaia Archive was accessed at https://gea.esac.esa.int/archive/
Appendix A: Substructuring of Sco-Cen-Lup
Subgroups of Sco-Cen-Lup as identified by Ratzenböck et al. (2023b).
Appendix B: Catalog search queries
The complete spherical volume of space to be searched was split into three smaller regions for each of which separate search queries were written. The innermost region is a spherical volume that contains all objects with parallaxes π ≥ 8.6 mas, which corresponds to a search radius of approximately 116.28 pc. The second region is a spherical shell around the first region and contains stars with parallaxes 6.03 mas ≤ π < 8.6 mas, i.e., stars with distances between 116.28 pc and 165.84 pc. The third region forms a spherical shell around the smaller two regions and spans the parallax interval of 0.588 mas ≤ π < 6.03 mas, or correspondingly, distances from 165.84 pc up to the maximum search radius of 1.7 kpc.
This was done for purely technical reasons: The two innermost regions are rather small compared to the whole volume of space within 1.7 kpc and consequently contain only a small fraction of the sample, which made these two regions ideal subsamples to test all employed methods first and to verify that no problems occur without having to run large datasets through the whole process all at once.
B.1. Gaia DR3
The queries posed to the Gaia Archive are listed below with syntax and formatting according to the standards of the Astronomical Data Query Language (ADQL).
Region 1:
SELECT *
FROM gaiadr3.gaia_source
WHERE parallax > = 8.6
AND phot_g_mean_mag - 5.0*LOG10(distance_gspphot) + 5.0-ag_gspphot_upper < = 0.65
Region 2:
SELECT *
FROM gaiadr3.gaia_source
WHERE parallax > = 6.03
AND parallax < 8.6
AND phot_g_mean_mag - 5.0*LOG10(distance_gspphot) + 5.0-ag_gspphot_upper < = 0.65
Region 3:
SELECT *
FROM gaiadr3.gaia_source
WHERE parallax > = 0.588
AND parallax < 6.03
AND phot_g_mean_mag - 5.0*LOG10(distance_gspphot) + 5.0-ag_gspphot_upper < = 0.65
The last line of each query is the distance modulus solved for the absolute magnitude (see Eq. (1)), which per Criterion 3 in Sect. 2.1 is required to satisfy MG ≤ 0.65 mag. Here, phot_g_mean_mag is the G-band mean magnitude, distance_gspphot is the distance determined from BP/RP spectra, and ag_gspphot_upper is the upper confidence level (84%) of the G-band extinction determined from BP/RP spectra. The upper limit of the absorption parameter was used in order to directly account for its error interval, retrieving the maximum number of stars.
B.2. HIPPARCOS
Only two constraints were employed for the HIPPARCOS search: the parallax (HIPPARCOS designation: Plx) ranges were defined for each region and the photometric magnitude in the optical V-band between 500 nm and 600 nm (HIPPARCOS designation: Vmag) was required to be smaller than or equal to 3.6 mag, resulting in the following HIPPARCOS queries:
Region 1:
Vmag < = 3.6
Plx > = 8.6 Region 2:
Vmag < = 3.6
Plx 6.03..8.6 Region 3:
Vmag < = 3.6
Plx 0.588..6.03
Appendix C: Subgroup radii
As discussed in Sect. 2.2.1, the individual subgroups were approximated to be spherical in shape. Subsequently, distance distributions of the group members were plotted for each subgroup and the FWHM values of these distributions were then used as subgroup radii. All subgroup radii are listed in Table A.1.
Below, the corresponding distributions are shown: For each group, the number of stars per distance interval are plotted. The resulting distributions can be approximated as Gaussian. In each plot, the mean and median distances are indicated for reference.
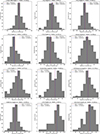 |
Fig. C.1. Distance distributions of the members of subgroups SigMA 1 - SigMA 12 with data from Ratzenböck et al. (2023b). |
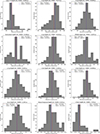 |
Fig. C.2. Distance distributions of the members of subgroups SigMA 13 - SigMA 24 with data from Ratzenböck et al. (2023b). |
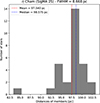 |
Fig. C.3. Distance distributions of the members of subgroup SigMA 25 with data from Ratzenböck et al. (2023b). |
Appendix D: Median radial velocities of the subgroups
As discussed in Sect. 2.2.2, the median radial velocities of the 25 analyzed subgroups have been determined from plotting the individual radial velocities of the respective group members as distributions. The resulting median values – along with the median absolute deviations of each dispersion as errors – were used for simulating the trajectories of the subgroups. All resulting median radial velocities are listed in Table A.1.
Below, the radial velocity distributions of all subgroups are shown. In each plot, the median radial velocity is indicated for reference.
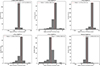 |
Fig. D.1. Radial velocity distributions of the members of subgroups SigMA 1 - SigMA 6 plotted primarily with data from Gaia DR3 and supplemented with data from the SIMBAD database. |
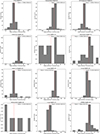 |
Fig. D.2. Radial velocity distributions of the members of subgroups SigMA 7 - SigMA 18 plotted primarily with data from Gaia DR3 and supplemented with data from the SIMBAD database. |
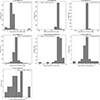 |
Fig. D.3. Radial velocity distributions of the members of subgroups SigMA 19 - SigMA 25 plotted primarily with data from Gaia DR3 and supplemented with data from the SIMBAD database. |
Appendix E: List of candidates with doubtful runaway status
The table below lists the candidate stars of questionable runaway stars that are discussed in Sect. 3.1.
Questionable runaway candidates. There are three stars in the sample with space velocities that are significantly larger than those of the other candidates.
Appendix F: Astrometric properties
The tables in this appendix show the astrometric data of the identified runaway candidates that was used for the tracebacks.
F.1. Runaway candidates
Astrometric parameters of the identified runaway candidates.
F.2. Candidates with doubtful runaway status
Astrometric parameters of the questionable runaway candidates.
Appendix G: Galactocentric coordinates and velocities
G.1. Subgroups
Table G.1 shows the Galactocentric coordinates X, Y and Z as well as the Galactocentric velocity components U, V and W of the subgroups of Sco-Cen-Lup. These coordinates and velocities were calculated from the parameters presented in Table A.1.
Galactocentric coordinates (X, Y, Z) and velocities (U, V, W) of the subgroups of Sco-Cen-Lup.
G.2. Runaway candidates
Table G.2 shows the Galactocentric coordinates X, Y and Z as well as the Galactocentric velocity components U, V and W of the runaway candidates listed in Table 1. These coordinates and velocities were calculated from the parameters presented in Appendix F.1.
Galactocentric coordinates (X, Y, Z) and velocities (U, V, W) of the runaway candidates.
G.3. Candidates with doubtful runaway status
Table G.3 shows the Galactocentric coordinates X, Y and Z as well as the Galactocentric velocity components U, V and W of the questionable runaway candidates listed in Table E.1. These coordinates and velocities were calculated from the parameters presented in Appendix F.2.
Galactocentric coordinates (X, Y, Z) and velocities (U, V, W) of the questionable runaway candidates.
Appendix H: Colors and magnitudes
In Sect. 3.7 and in Appendix J, the positions of the identified runaway candidates on various color-magnitude diagrams are shown. The tables in this appendix show the plotted data. The absolute magnitudes, MG, were calculated according to Eq. (1). Since the color index GBP − GRP is a quantity that is specific to the Gaia satellite and since the data for some of the stars (γ Gru, γ Crv, α2 CVn, β Lib, ζ Oph) was taken from the HIPPARCOS catalog – which offers the Johnson B − V color index as an equivalent. The following conversion (Wischnewski 2022; van Leeuwen et al. 2022) between these two photometric systems was employed:
 (H.1)
(H.1)
where x = GBP − GRP.
H.1. Runaway candidates
Photometric data of the runaway candidates.
H.2. Candidates with doubtful runaway status
Photometric data of the three questionable runaway candidates.
Appendix I: Flight paths of ζ Oph and PSR B1706-16
Figure I.1 shows the flight paths of the runaway star ζ Oph and pulsar B1706-16 in relation to the past and present positions of UCL as a whole as well as subgroups SigMA 9, 15, and 21. See Sect. 3.6 for details.
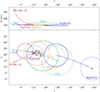 |
Fig. I.1. Close approaches of PSR B1706-16 and ζ Oph (adapted from Fig. 2 of Neuhäuser et al. 2020). Lower panel: Flight paths (colored lines) for the closest approach of PSR B1706-16 and ζ Oph (best case) projected on the sky (Galactic longitude l versus Galactic latitude b at epoch of date). The paths start at their current positions (left) and are subsequently marked by small crosses after every 0.5 Myr of flight time. They end at the closest approach within 0.5 pc of each other 1.58 Myr before present (center). UCL’s position 1.58 Myr ago is shown as a full green circle and its current location is represented by the dotted green circle. The gray dots show the 117 closest approaches of PSR B1706-16 and ζ Oph (i.e., within 10 pc of each other) inside UCL. Upper panel: Distance, D, versus Galactic longitude, l, for the past flight paths. The lines from ζ Oph and the pulsar do not start directly at their nominal positions (dots) because here, we show the distances that were used as input in that particular run (best case among three million runs with varying input using the measurement uncertainties). All this was for UCL as a whole instead of its SigMA subgroups. See Neuhäuser et al. (2020) for further details. According to our new calculations, we have added the location of the subgroups SigMA 9, 15, and 21 – in each case both their current positions (dotted circles) and at the time of the closest encounter with ζ Oph (full circles). We can see that the flight path of ζ Oph traced back in time led it through SigMA 9 (US) first, then SigMa 15 in UCL, and then, if further extrapolated, also through SigMA 21 (as well as 19 and 20) in LCC. Next, we have also added the neutron star PSR B1706-16 in the traceback calculations; for the results, see Fig. 2 and Sect. 3.6 for more details. |
Appendix J: Color-magnitude diagrams of the individual subgroups
As discussed in Sect. 3.7, one of the methods employed by us to judge how likely it is that our identified runaway candidates indeed once belonged to the respective subgroups of Sco-Cen-Lup is to compare their position on the color-magnitude diagram to those of confirmed members of the respective groups. If the position of the runaway star is comparable to the positions of the subgroup members, it is likely that the runaway star follows a similar evolutionary path as the stars within the respective subgroup. Below, the identified runaways are plotted on the color-magnitude diagrams of the individual subgroups. Here, we only plot the subgroups that allow for at least one supernova and for which at least one runaway candidate was found.
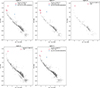 |
Fig. J.1. Color-magnitude diagrams for subgroups SigMA 5, 8, 9, 10, 13, and 14. The runaways (large red crosses) and questionable runaways (large blue dots; see Sect. 3.1) that encountered these subgroups are shown along with the member stars (gray dots) of each subgroup. For these plots, the membership lists of the subgroups provided by Ratzenboeck et al. (2023) were used to obtain parallaxes, apparent magnitudes, and extinction parameters from Gaia DR3, from which the absolute magnitudes were calculated using Eq. (1). The plotted data for the identified runaway candidates is listed in Appendix H. |
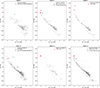 |
Fig. J.2. Color-magnitude diagrams for subgroups SigMA 15, 17, 19, 20, and 21. The runaways (large red crosses) and questionable runaways (large blue dots; see Sect. 3.1) that encountered these subgroups are shown along with the member stars (gray dots) of each subgroup. For these plots, the membership lists of the subgroups provided by Ratzenboeck et al. (2023) were used to obtain parallaxes, apparent magnitudes, and extinction parameters from Gaia DR3, from which the absolute magnitudes were calculated using Eq. (1). The plotted data for the identified runaway candidates is listed in Appendix H. |
All Tables
Questionable runaway candidates. There are three stars in the sample with space velocities that are significantly larger than those of the other candidates.
Galactocentric coordinates (X, Y, Z) and velocities (U, V, W) of the subgroups of Sco-Cen-Lup.
Galactocentric coordinates (X, Y, Z) and velocities (U, V, W) of the runaway candidates.
Galactocentric coordinates (X, Y, Z) and velocities (U, V, W) of the questionable runaway candidates.
All Figures
|
Fig. 1. Number of calculated encounters per 1000 simulated orbits of the remaining candidates. Upper panel: Bar chart of the calculated encounters of every star-subgroup pair. Lower panel: Histogram displaying how often a certain number of encounters occurs in the sample. The identified threshold of 150 encounters per 1000 simulated orbits is indicated by a dashed red line. |
| In the text | |
|
Fig. 2. Close approaches of PSR B1706-16 and ζ Oph in SigMA 15. Lower panel: Flight paths (colored lines) for the closest approach of PSR B1706-16 and ζ Oph (best case) projected on the sky (Galactic longitude l versus Galactic latitude b at epoch of date). The paths start at their current positions (left) and are subsequently marked by small crosses after every 0.5 Myr of flight time. They end at the closest approach within 0.1 pc of each other 1.5 Myr before present (center). SigMA 15 is shown with an orange circle both 1.5 Myr ago (full line) and now (dashed). The gray dots show the 661 closest approaches of PSR B1706-16 and SigMA 15 (i.e., within 10 pc of each other). Upper panel: Distance, D, versus Galactic longitude, l, for the past flight paths. UCL’s position some 1.5 Myr ago is shown as a full green circle, and its current location is represented by the dotted green circle. These are for the best case in Neuhäuser et al. (2020). |
| In the text | |
|
Fig. 3. Member stars of Sco-Cen-Lup (small gray dots), the identified runaway candidates (red crosses), and the three questionable runaway candidates (large blue dots; see Sect. 3.1) on the color-magnitude diagram. |
| In the text | |
|
Fig. C.1. Distance distributions of the members of subgroups SigMA 1 - SigMA 12 with data from Ratzenböck et al. (2023b). |
| In the text | |
|
Fig. C.2. Distance distributions of the members of subgroups SigMA 13 - SigMA 24 with data from Ratzenböck et al. (2023b). |
| In the text | |
|
Fig. C.3. Distance distributions of the members of subgroup SigMA 25 with data from Ratzenböck et al. (2023b). |
| In the text | |
|
Fig. D.1. Radial velocity distributions of the members of subgroups SigMA 1 - SigMA 6 plotted primarily with data from Gaia DR3 and supplemented with data from the SIMBAD database. |
| In the text | |
|
Fig. D.2. Radial velocity distributions of the members of subgroups SigMA 7 - SigMA 18 plotted primarily with data from Gaia DR3 and supplemented with data from the SIMBAD database. |
| In the text | |
|
Fig. D.3. Radial velocity distributions of the members of subgroups SigMA 19 - SigMA 25 plotted primarily with data from Gaia DR3 and supplemented with data from the SIMBAD database. |
| In the text | |
|
Fig. I.1. Close approaches of PSR B1706-16 and ζ Oph (adapted from Fig. 2 of Neuhäuser et al. 2020). Lower panel: Flight paths (colored lines) for the closest approach of PSR B1706-16 and ζ Oph (best case) projected on the sky (Galactic longitude l versus Galactic latitude b at epoch of date). The paths start at their current positions (left) and are subsequently marked by small crosses after every 0.5 Myr of flight time. They end at the closest approach within 0.5 pc of each other 1.58 Myr before present (center). UCL’s position 1.58 Myr ago is shown as a full green circle and its current location is represented by the dotted green circle. The gray dots show the 117 closest approaches of PSR B1706-16 and ζ Oph (i.e., within 10 pc of each other) inside UCL. Upper panel: Distance, D, versus Galactic longitude, l, for the past flight paths. The lines from ζ Oph and the pulsar do not start directly at their nominal positions (dots) because here, we show the distances that were used as input in that particular run (best case among three million runs with varying input using the measurement uncertainties). All this was for UCL as a whole instead of its SigMA subgroups. See Neuhäuser et al. (2020) for further details. According to our new calculations, we have added the location of the subgroups SigMA 9, 15, and 21 – in each case both their current positions (dotted circles) and at the time of the closest encounter with ζ Oph (full circles). We can see that the flight path of ζ Oph traced back in time led it through SigMA 9 (US) first, then SigMa 15 in UCL, and then, if further extrapolated, also through SigMA 21 (as well as 19 and 20) in LCC. Next, we have also added the neutron star PSR B1706-16 in the traceback calculations; for the results, see Fig. 2 and Sect. 3.6 for more details. |
| In the text | |
|
Fig. J.1. Color-magnitude diagrams for subgroups SigMA 5, 8, 9, 10, 13, and 14. The runaways (large red crosses) and questionable runaways (large blue dots; see Sect. 3.1) that encountered these subgroups are shown along with the member stars (gray dots) of each subgroup. For these plots, the membership lists of the subgroups provided by Ratzenboeck et al. (2023) were used to obtain parallaxes, apparent magnitudes, and extinction parameters from Gaia DR3, from which the absolute magnitudes were calculated using Eq. (1). The plotted data for the identified runaway candidates is listed in Appendix H. |
| In the text | |
|
Fig. J.2. Color-magnitude diagrams for subgroups SigMA 15, 17, 19, 20, and 21. The runaways (large red crosses) and questionable runaways (large blue dots; see Sect. 3.1) that encountered these subgroups are shown along with the member stars (gray dots) of each subgroup. For these plots, the membership lists of the subgroups provided by Ratzenboeck et al. (2023) were used to obtain parallaxes, apparent magnitudes, and extinction parameters from Gaia DR3, from which the absolute magnitudes were calculated using Eq. (1). The plotted data for the identified runaway candidates is listed in Appendix H. |
| In the text | |
Current usage metrics show cumulative count of Article Views (full-text article views including HTML views, PDF and ePub downloads, according to the available data) and Abstracts Views on Vision4Press platform.
Data correspond to usage on the plateform after 2015. The current usage metrics is available 48-96 hours after online publication and is updated daily on week days.
Initial download of the metrics may take a while.