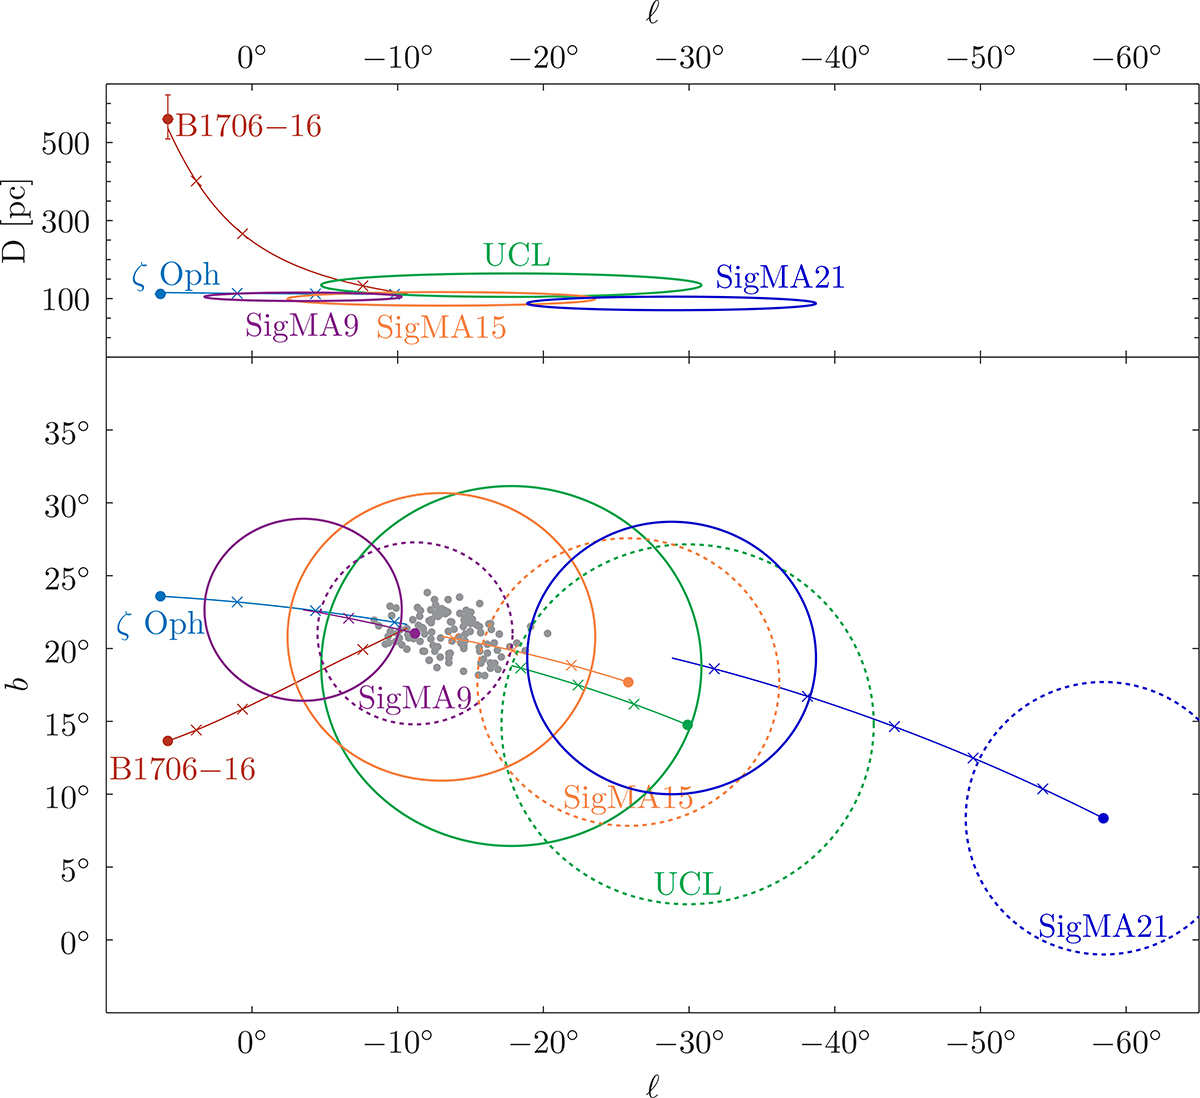
Fig. I.1.
Download original image
Close approaches of PSR B1706-16 and ζ Oph (adapted from Fig. 2 of Neuhäuser et al. 2020). Lower panel: Flight paths (colored lines) for the closest approach of PSR B1706-16 and ζ Oph (best case) projected on the sky (Galactic longitude l versus Galactic latitude b at epoch of date). The paths start at their current positions (left) and are subsequently marked by small crosses after every 0.5 Myr of flight time. They end at the closest approach within 0.5 pc of each other 1.58 Myr before present (center). UCL’s position 1.58 Myr ago is shown as a full green circle and its current location is represented by the dotted green circle. The gray dots show the 117 closest approaches of PSR B1706-16 and ζ Oph (i.e., within 10 pc of each other) inside UCL. Upper panel: Distance, D, versus Galactic longitude, l, for the past flight paths. The lines from ζ Oph and the pulsar do not start directly at their nominal positions (dots) because here, we show the distances that were used as input in that particular run (best case among three million runs with varying input using the measurement uncertainties). All this was for UCL as a whole instead of its SigMA subgroups. See Neuhäuser et al. (2020) for further details. According to our new calculations, we have added the location of the subgroups SigMA 9, 15, and 21 – in each case both their current positions (dotted circles) and at the time of the closest encounter with ζ Oph (full circles). We can see that the flight path of ζ Oph traced back in time led it through SigMA 9 (US) first, then SigMa 15 in UCL, and then, if further extrapolated, also through SigMA 21 (as well as 19 and 20) in LCC. Next, we have also added the neutron star PSR B1706-16 in the traceback calculations; for the results, see Fig. 2 and Sect. 3.6 for more details.
Current usage metrics show cumulative count of Article Views (full-text article views including HTML views, PDF and ePub downloads, according to the available data) and Abstracts Views on Vision4Press platform.
Data correspond to usage on the plateform after 2015. The current usage metrics is available 48-96 hours after online publication and is updated daily on week days.
Initial download of the metrics may take a while.