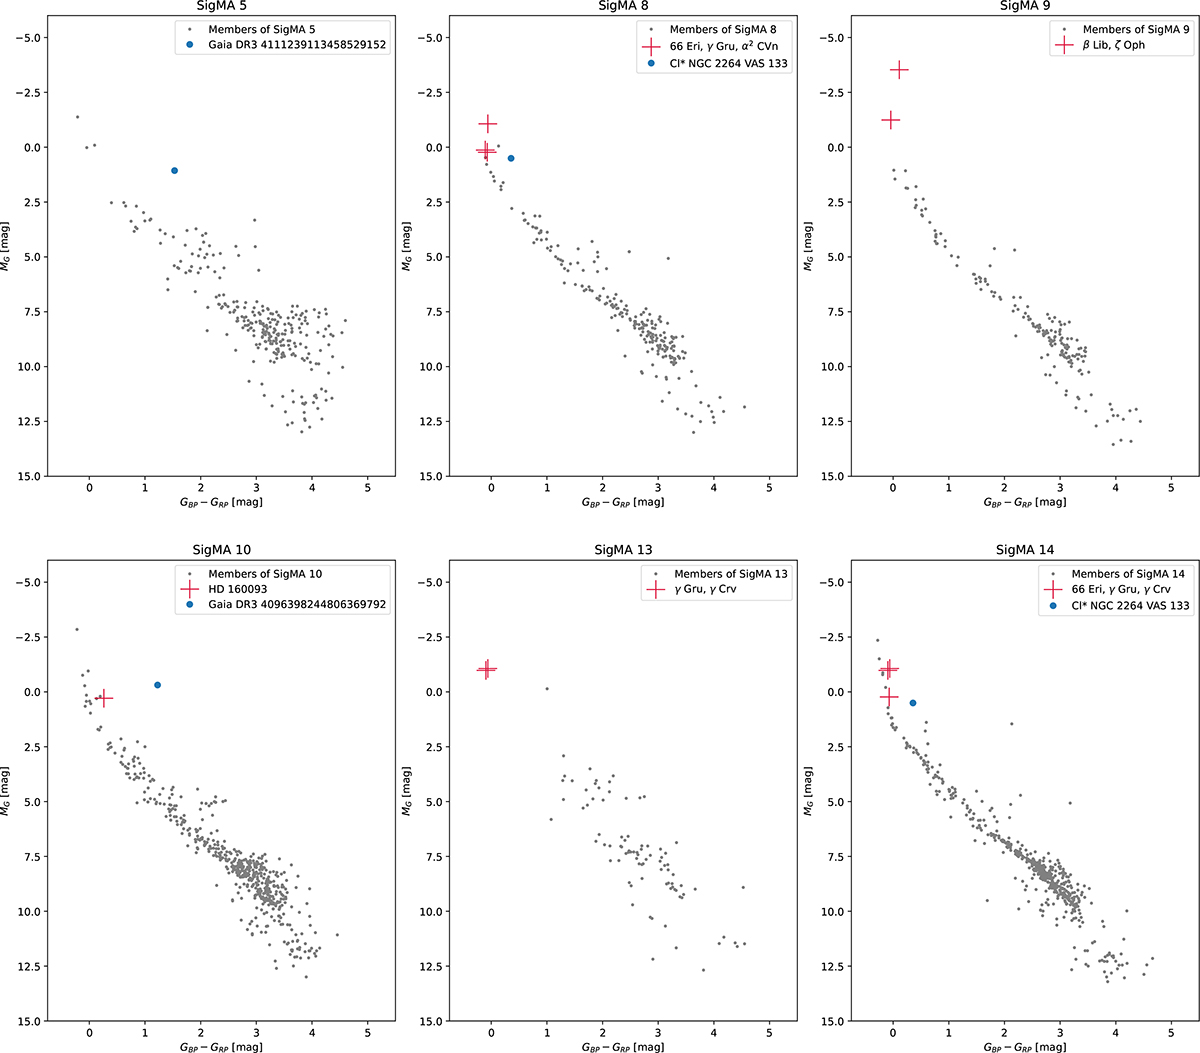
Fig. J.2.
Download original image
Color-magnitude diagrams for subgroups SigMA 15, 17, 19, 20, and 21. The runaways (large red crosses) and questionable runaways (large blue dots; see Sect. 3.1) that encountered these subgroups are shown along with the member stars (gray dots) of each subgroup. For these plots, the membership lists of the subgroups provided by Ratzenboeck et al. (2023) were used to obtain parallaxes, apparent magnitudes, and extinction parameters from Gaia DR3, from which the absolute magnitudes were calculated using Eq. (1). The plotted data for the identified runaway candidates is listed in Appendix H.
Current usage metrics show cumulative count of Article Views (full-text article views including HTML views, PDF and ePub downloads, according to the available data) and Abstracts Views on Vision4Press platform.
Data correspond to usage on the plateform after 2015. The current usage metrics is available 48-96 hours after online publication and is updated daily on week days.
Initial download of the metrics may take a while.