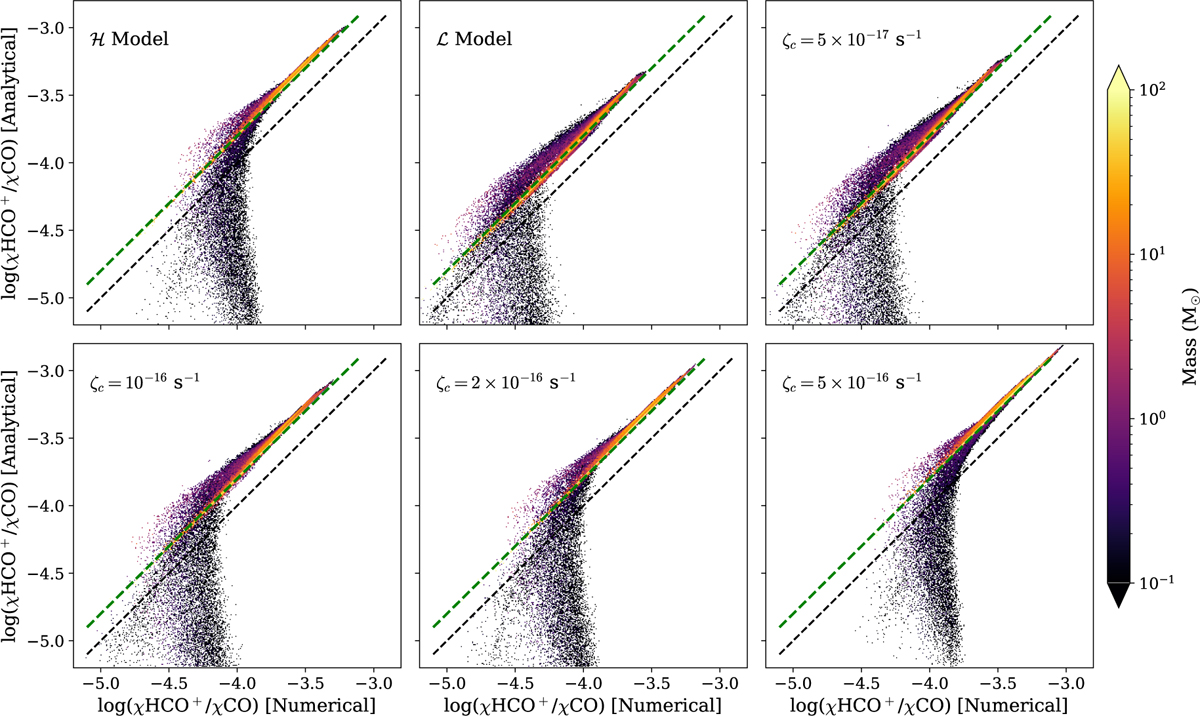
Fig. 10
Download original image
Mass-weighted 1: 1 comparison plots between analytical calibrators and numerical results for the abundance ratio, χ(HCO+)/χ(CO). The CR model is annotated in each panel. The dashed black line represents the 1: 1 reference, and the dashed green line shows the linearity of the data and the relative deviation in linearity among the models. The data are filtered under the constraints UV <0.1 G0 and nH>103 cm−3 for clarity.
Current usage metrics show cumulative count of Article Views (full-text article views including HTML views, PDF and ePub downloads, according to the available data) and Abstracts Views on Vision4Press platform.
Data correspond to usage on the plateform after 2015. The current usage metrics is available 48-96 hours after online publication and is updated daily on week days.
Initial download of the metrics may take a while.