Fig. 13
Download original image
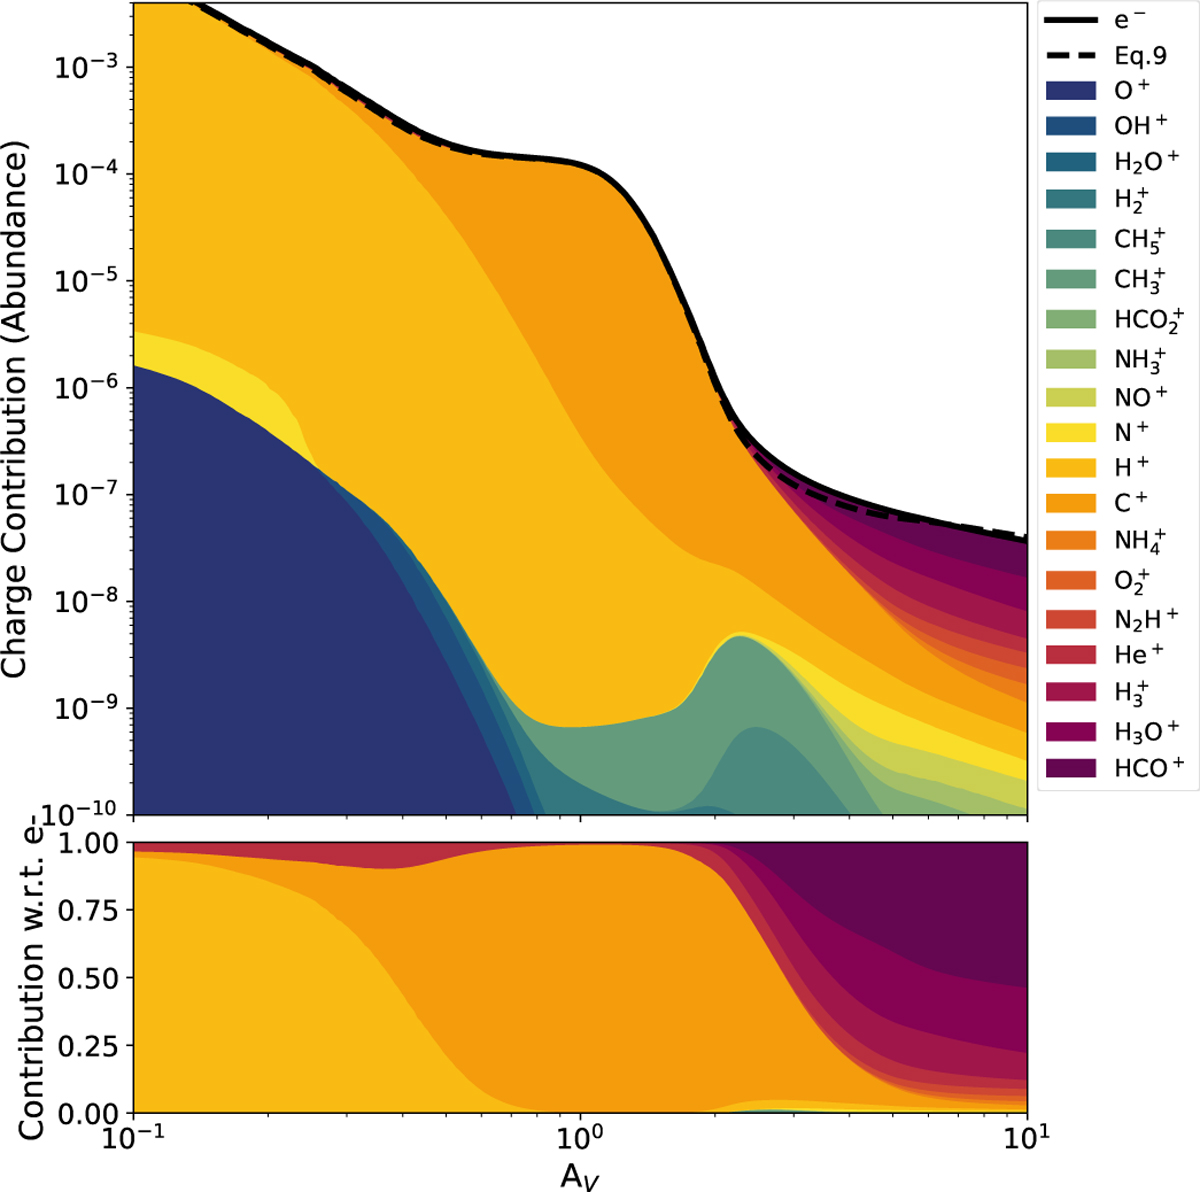
1D AV−nH slab for charge contribution. The top panel displays the abundance of electrons (solid line) and the corresponding analytical expression (dashed line). The colors show cumulative contributions to the ion balance for positive ions, and the bottom panel shows the normalized cumulative contributions with respect to electron abundance.
Current usage metrics show cumulative count of Article Views (full-text article views including HTML views, PDF and ePub downloads, according to the available data) and Abstracts Views on Vision4Press platform.
Data correspond to usage on the plateform after 2015. The current usage metrics is available 48-96 hours after online publication and is updated daily on week days.
Initial download of the metrics may take a while.