Fig. 2.
Download original image
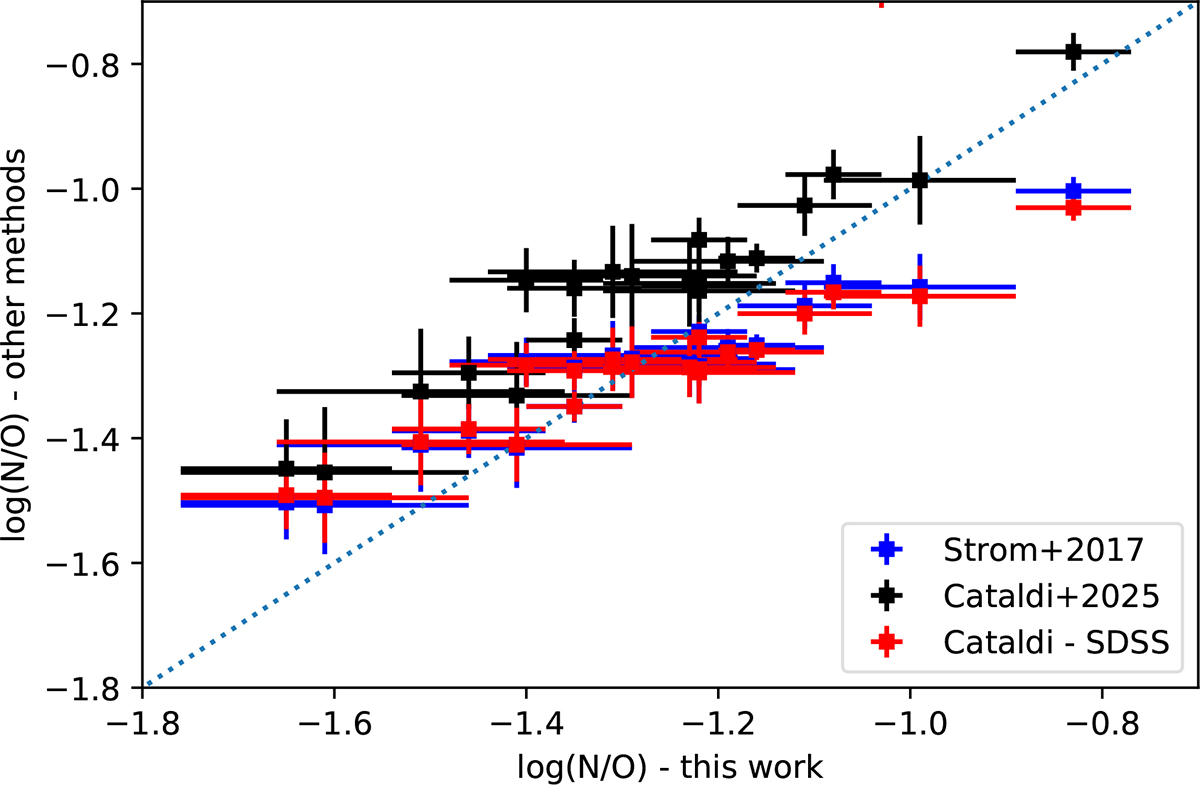
Comparison of N/O abundances derived following the direct method and the assumptions described in this work (x-axis) with those adopting the strong line calibrations of Cataldi et al. (2025a) based on JWST samples (in black; applicable for z > 1) and an SDSS sample (red, applicable at low z), and the calibration from Strom et al. (2017) (blue). All strong line calibrations used the extinction-corrected line ratio of [N II] λ6584/[O II] λλ3727,3729.
Current usage metrics show cumulative count of Article Views (full-text article views including HTML views, PDF and ePub downloads, according to the available data) and Abstracts Views on Vision4Press platform.
Data correspond to usage on the plateform after 2015. The current usage metrics is available 48-96 hours after online publication and is updated daily on week days.
Initial download of the metrics may take a while.