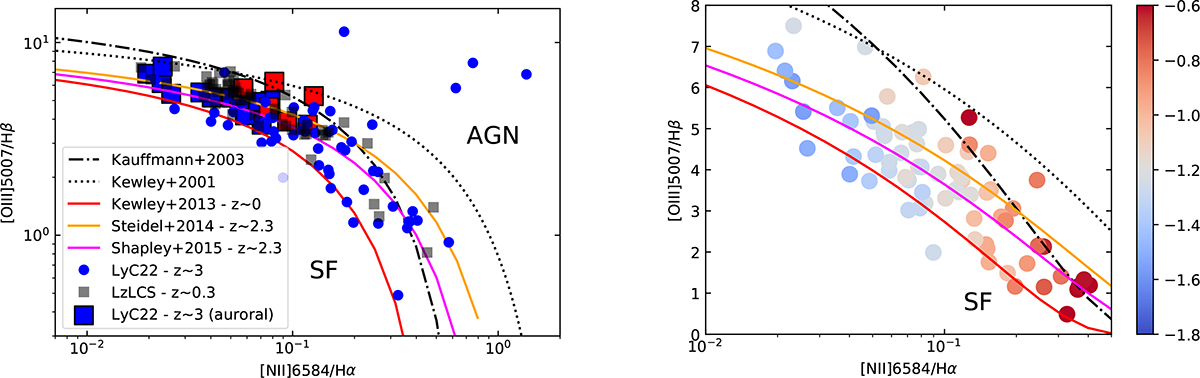
Fig. 3.
Download original image
Left: Classical emission-line diagnostic diagram showing the galaxies from the LyC22 sample (blue and red symbols). LyC22 objects with significant [O III] λ4363 detections are surrounded by a black square. LyC22 galaxies with log(N/O) > − 1.2 are shown in red. We only show objects where the involved emission lines are detected at ≥3σ. Typical uncertainties are comparable to the size of the symbols and are hence not plotted. The maximum starburst line from Kewley et al. (2001) (dotted) and the empirical AGN/star-formation threshold from Kauffmann et al. (2003) established for z ∼ 0 (dash-dotted) are also shown. Average relations for z ∼ 2.3 galaxies from Steidel et al. (2014), Shapley et al. (2015) are shown by orange and magenta lines; the average relation of SDSS galaxies from Kewley et al. (2013a) is shown by the red line. Observations from the LzLCS at z ∼ 0.3 are shown by small gray squares. Right: Zoomed-in view of part of the BPT diagram showing all LyC22 sources with color-coded N/O abundances (in log(N/O)); computed from [N II]/[O II].
Current usage metrics show cumulative count of Article Views (full-text article views including HTML views, PDF and ePub downloads, according to the available data) and Abstracts Views on Vision4Press platform.
Data correspond to usage on the plateform after 2015. The current usage metrics is available 48-96 hours after online publication and is updated daily on week days.
Initial download of the metrics may take a while.