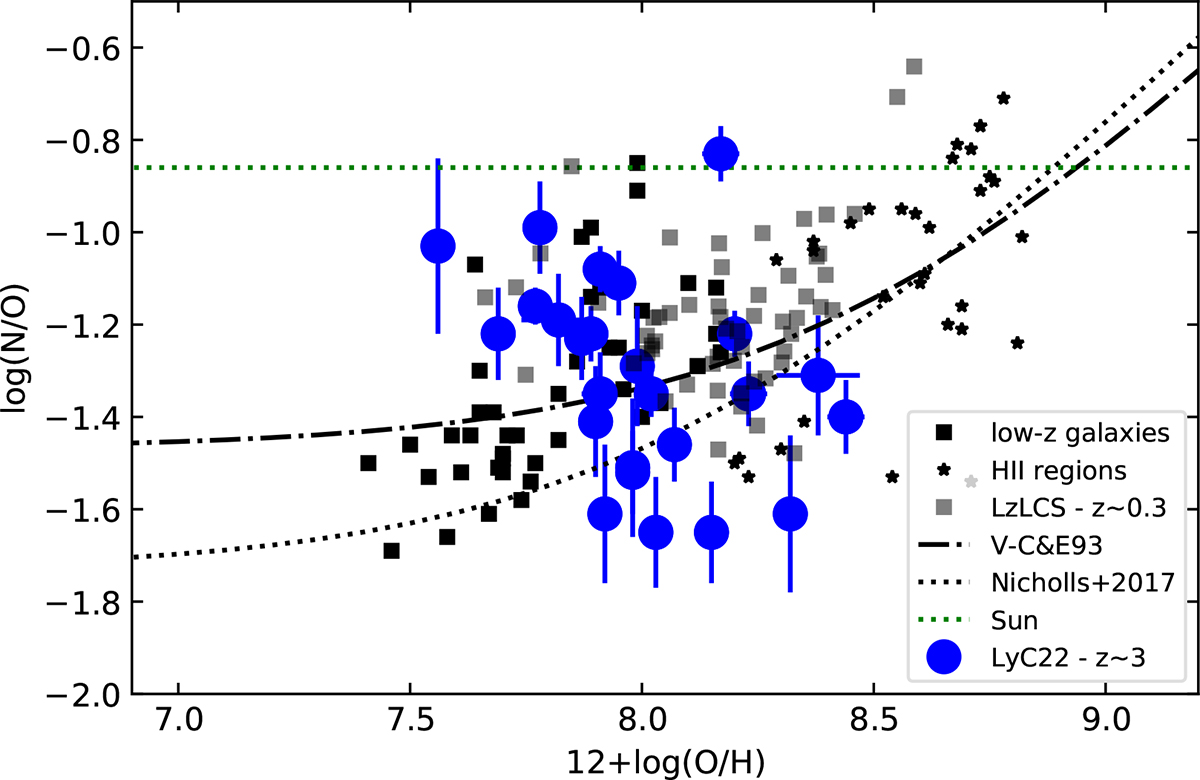
Fig. 4.
Download original image
Derived abundance ratio N/O from rest-optical lines of the LyC22 galaxies (blue circles) and low-z samples as a function of O/H. The low-z star-forming galaxies and H II regions from the compilation of Izotov et al. (2023) and the LzLCS are shown by small black and gray symbols, respectively. Dash-dotted and dotted lines show the average trend observed in low-z star-forming galaxies, as parametrized by Vila-Costas & Edmunds (1993) and Nicholls et al. (2017), respectively. The dotted green line shows the solar value.
Current usage metrics show cumulative count of Article Views (full-text article views including HTML views, PDF and ePub downloads, according to the available data) and Abstracts Views on Vision4Press platform.
Data correspond to usage on the plateform after 2015. The current usage metrics is available 48-96 hours after online publication and is updated daily on week days.
Initial download of the metrics may take a while.