| Issue |
A&A
Volume 708, April 2026
|
|
|---|---|---|
| Article Number | A155 | |
| Number of page(s) | 8 | |
| Section | Stellar structure and evolution | |
| DOI | https://doi.org/10.1051/0004-6361/202556862 | |
| Published online | 03 April 2026 | |
Extreme mass loss during common envelope evolution: The origin of the double low-mass white dwarf system J2102–4145★
1
Departament de Física, Universitat Politècnica de Catalunya, c/ Esteve Terrades 5, 08860, Castelldefels, Spain
2
Grupo de Evolución Estelar y Pulsaciones, Facultad de Ciencias Astronómicas y Geofísicas, Universidad Nacional de La Plata, CONICET-IALP, Paseo del Bosque s/n, 1900, La Plata, Argentina
3
Instituto de Física y Astronomía, Universidad de Valparaíso, Av. Gran Bretaña 1111, 5030, Casilla, Valparaíso, Chile
4
Institut d’Estudis Espacials de Catalunya (IEEC), C/ Esteve Terradas 1, Edifici RDIT, 08860, Castelldefels, Spain
★★ Corresponding author: This email address is being protected from spambots. You need JavaScript enabled to view it.
Received:
14
August
2025
Accepted:
8
March
2026
Abstract
Context. Eclipsing close double white dwarf (WD) systems, by providing precise radii and masses, offer a unique opportunity to directly constrain hydrogen-envelope (MH) retention and test common-envelope (CE) evolution in low-mass stars.
Aims. We analyse J2102–4145, an eclipsing binary composed of two low-mass He-core WDs in a 2.4-hour orbit.
Methods. By comparing the observed radii and effective temperatures with updated CE and stable Roche-lobe overflow (SRLOF) models, we confirm that both stars are He-core WDs.
Results. The primary (0.375 M⊙) is consistent with SRLOF models that retain thick H envelopes and sustain residual burning, while the secondary (0.314 M⊙) can only be reproduced by CE models with nearly complete envelope removal. The cooling ages – ∼220 Myr for the secondary and ∼260–510 Myr for the primary, depending on the residual nuclear contribution – support a formation sequence in which the primary formed first via SRLOF, followed by a CE phase producing the compact secondary. Energy-budget reconstruction of the CE yields progenitor and orbital parameters consistent with this picture.
Conclusions. The secondary’s unusually small radius requires an extremely thin H envelope, MH ≲ 10−7 M⊙, well below the predictions of standard bifurcation criteria. J2102–4145 thus provides one of the strongest observational constraints on post-CE MH in low-mass WDs and a benchmark challenge to current prescriptions of envelope ejection.
Key words: binaries: close / binaries: eclipsing / stars: evolution / stars: interiors / stars: low-mass / white dwarfs
The cooling sequences are publicly available at http://evolgroup.fcaglp.unlp.edu.ar.
© The Authors 2026
 Open Access article, published by EDP Sciences, under the terms of the Creative Commons Attribution License (https://creativecommons.org/licenses/by/4.0), which permits unrestricted use, distribution, and reproduction in any medium, provided the original work is properly cited.
This article is published in open access under the Subscribe to Open model. This email address is being protected from spambots. You need JavaScript enabled to view it. to support open access publication.
1. Introduction
White dwarfs (WDs) are the most common endpoints of low- and intermediate-mass stars (Althaus et al. 2010; Woosley & Heger 2015). The WD mass distribution peaks near 0.6 M⊙, but it also shows a low-mass tail (≲0.45 M⊙), which likely results from enhanced red-giant branch (RGB) mass loss – most commonly driven by a binary interaction – before core helium (He) ignition, producing a He core rather than carbon–oxygen (C/O) cores (Cassisi & Salaris 2013; Althaus et al. 2013; Istrate et al. 2016). Above ∼0.32 M⊙, some objects may be hybrid He–C/O WDs (Zenati et al. 2019).
Forming low-mass WDs within a Hubble time requires a binary interaction, as single-star evolution is too slow. Most of these WDs are indeed found in binaries (Marsh et al. 1995; Rebassa-Mansergas et al. 2011; Brown et al. 2020). Two channels dominate the formation of He-core WDs: stable Roche-lobe overflow (SRLOF) and common-envelope (CE) evolution. Population studies indicate that extremely low-mass (ELM) WDs with M ≲ 0.22 M⊙ form predominantly via the SRLOF channel, whereas those with M ≳ 0.22 M⊙ are more likely the outcome of a CE episode (Li et al. 2019; Brown et al. 2020). Because the mass-loss histories differ, the post-formation structures and cooling behaviours of low-mass WDs are observably distinct. A key quantity is the residual hydrogen (H) mass, MH, defined here as the total H mass above the He core. In general, SRLOF leaves WDs with relatively large values of MH, whereas CE evolution leads to much more efficient envelope stripping and hence significantly smaller residual MH. Larger MH can sustain residual H burning and inflate the stellar radius, thereby modifying the inferred mass and cooling age at a fixed Teff (Althaus et al. 2013; Istrate et al. 2016).
Eclipsing low-mass WD binaries provide precise, geometrically constrained masses and radii and therefore enable stringent tests of structure, evolution, and formation scenarios (Brown et al. 2023). In particular, J2102−4145 is a double-lined, eclipsing binary of two low-mass WDs with accurately measured M, R, and Teff (Kosakowski et al. 2023; Antunes Amaral et al. 2024). Here we confront these measurements with SRLOF models (Althaus et al. 2013) and with CE sequences that span a broad range of MH, including a recently published grid tailored to post-CE remnants (Althaus et al. 2025). We find that the secondary (less massive) WD’s observed compactness at its Teff is reproduced only by models with an extremely thin H envelope. Accordingly, we report a robust upper limit on MH. For the primary (more massive) WD, we reassessed SRLOF models and quantified how residual H burning affects the inferred cooling age. Taken together, these results support an evolutionary pathway in which the primary formed through SRLOF and the secondary through a subsequent CE episode.
Section 2 describes the observations and the adopted stellar parameters. Sect. 3 introduces the evolutionary models: Sect. 3.1 presents the CE sequences and bifurcation criteria, while Sect. 3.2 describes the SRLOF tracks. Sect. 4 presents the radius–temperature comparison for J2102−4145 and the inferred envelope properties, including the possible effects of rotation and tides. In this section the corresponding cooling ages are also discussed. Sect. 5 outlines the evolutionary pathway linking SRLOF to the primary and CE to the secondary. In Sect. 6 we examine the relation between the inferred MH values and the CE efficiency, and discuss the implications for envelope stripping in low-mass giant progenitors. Finally, Sect. 7 summarises our conclusions.
2. Observations and adopted parameters
J2102−4145 is a double-lined, eclipsing binary of two low-mass WDs. We adopted the published orbital and stellar parameters from the joint modelling of multiband light curves and radial velocities presented by Antunes Amaral et al. (2024). The orbital period is P = 0.1002087525(10) d (≃2.405 h) and the orbital inclination is  deg (Table 3 of Antunes Amaral et al. 2024). Eclipses provide the inclination and tight geometric constraints on the fractional radii, while the RV semi-amplitudes yield dynamical masses through Kepler’s law. The eclipse morphology (ingress and egress durations) sets R/a, and the relative depths constrain the surface-brightness ratio; combining these with the RV solution gives M and R for each component with high precision. Spectroscopic fits provide Teff values; throughout this work we use the 1σ uncertainties reported by Antunes Amaral et al. (2024) and do not re-analyse the photometric or spectroscopic data.
Table 1 lists the masses, radii, and Teff adopted here for the primary and secondary. These observables constitute the data vector against which we confront SRLOF and CE evolutionary models in Sect. 4. When inferring cooling ages, we evaluate the model age at the measured Teff of each component and propagate the observational uncertainty in Teff along the corresponding track at fixed M and, for CE models, fixed MH. In the R–Teff comparison we use the quoted 1σ error bars on both quantities.
Observed parameters for J2102–4145 adopted in this work.
3. Evolutionary models
In this section we outline the evolutionary inputs used to interpret J2102−4145, focusing on the single parameter that drives the differences between channels – MH, which controls radius inflation and residual burning. Sect. 3.1 summarises the CE construction and the compression-point guided stripping adopted for the secondary; Sect. 3.2 recalls the SRLOF grids used for the primary and how we bracket the effect of residual burning.
3.1. CE sequences: Setup, bifurcation criteria, and thin-envelope behaviour
We adopted the CE grid tailored to post-CE remnants by Althaus et al. (2025). A solar-metallicity RGB progenitor is evolved until the H-free core reaches the target mass; the envelope is then removed abruptly down to a prescribed Lagrangian mass coordinate mr (i.e. the enclosed mass measured from the stellar centre), which sets the remaining MH. The stripped model is relaxed at fixed total mass and evolved with the La Plata stellar evolution code LPCODE (Althaus et al. 2005; Salaris et al. 2013; Althaus et al. 2015; Miller Bertolami 2016; Althaus & Córsico 2022) onto the cooling track. Because mass stripping proceeds much faster than the thermal timescale, the remnant contracts to the hot pre-WD phase on a timescale much shorter than its thermal time; for the thin-MH regime of interest here, typical adjustment times from ejection to the pre-WD maximum Teff are below about 0.01 Myr. Shortly after stripping, the outer layers are He-enriched; as the star settles on the WD branch, gravitational settling builds a pure-H surface above a He-rich tail, with measurable consequences for R, log g, and cooling rates (Althaus et al. 2025).
After a dynamical CE, some H remains bound to the core rather than being fully expelled (Lombardi et al. 2006; Ivanova 2011); this final MH is crucial for the subsequent evolution of the He WD. A major modelling uncertainty is the location of the bifurcation point (BP), the mass coordinate that separates the retained core from the ejected envelope. In practice, the BP lies within the H-rich layers, between the H-free core and the base of the convective envelope. Several physically motivated criteria have been proposed to identify this boundary, including features in the entropy profile, breaks in the binding-energy distribution, and diagnostics tied to the structure of the H-burning shell (Han et al. 1994; Tauris & Dewi 2001; Ivanova et al. 2013; Kruckow et al. 2016; Vigna-Gómez et al. 2022; Chen et al. 2024). In this work, we focused on three commonly adopted BP diagnostics that are directly relevant for our CE models: the layer where the H abundance drops to XH = 0.1, the location of peak nuclear energy generation in the H-burning shell, and the maximum compression point mcp, defined by the local maximum of P/ρ inside the H-burning shell prior to CE (Ivanova 2011). Remnants stripped to or below mcp relax by contracting; if the remnant is left above mcp it tends to re-expand on a local thermal timescale and shed additional mass until stabilizing near mcp. Thus, mcp provides a physically meaningful core–envelope boundary for CE outcomes and naturally leads to comparatively thin residual H contents.
For reference, Fig. 1 shows the internal structure of a pre-CE RGB progenitor with 1.5 M⊙ at the epoch when the H-free core reaches 0.3202 M⊙. We plot the H abundance profile XH(mr) and the cumulative H mass interior to the Lagrangian mass coordinate mr, MH(< mr), which increases outwards through the envelope. Vertical dashed lines mark the three BP diagnostics discussed above (XH = 0.1, peak nuclear energy generation, and maximum compression). The dashed green line indicates MH = 1.0 × 10⁻⁷ M⊙, the H content required to reproduce the observed radius of the secondary at its measured Teff (Sect. 4). Although the figure corresponds to a 1.5 M⊙ progenitor, it serves as an illustrative snapshot of how the remaining H content maps to the stripping depth within the H-rich layers. This qualitative correspondence applies directly to the CE sequences employed in this work.
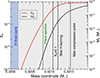 |
Fig. 1. Internal structure of a 1.5 M⊙ pre-CE RGB star at the epoch when the H-free core is 0.3202 M⊙ (plotted versus the Lagrangian mass coordinate mr). Shown are the H abundance by mass, XH(mr), and the cumulative H mass interior to mr, MH(< mr), which increases outwards. Vertical dashed lines mark the BP criteria (XH = 0.1, peak nuclear energy generation, and maximum compression). The dashed green line marks MH = 1.0 × 10⁻⁷ M⊙, the H content inferred for the secondary of J2102–4145 from the observed (R, Teff). The plot shows only the innermost envelope layers of the RGB progenitor, which set the residual H content. |
From the published set we employed the CE tracks at M = 0.3208 M⊙ with MH = 6.6 × 10⁻⁶ M⊙ and at M = 0.363 M⊙ with MH = 5 × 10⁻⁶ M⊙, and we computed two additional thin-envelope sequences at the same M = 0.3208 M⊙ with MH = 10−6 and 10−7 M⊙ to probe the regime relevant to the secondary of J2102−4145. These are the CE tracks used in the R–Teff and Teff–age comparisons (Sect. 4).
3.2. SRLOF sequences
For the primary we useed SRLOF He-core WD sequences from Althaus et al. (2013). In contrast to our CE remnants with very thin envelopes, SRLOF histories leave thicker H layers that sustain residual H burning during much of the cooling phase. This tends to inflate the radius at a given Teff and to lengthen the cooling timescales at intermediate temperatures. In the mass range relevant here, the SRLOF track that best matches the primary has an envelope of order MH ∼ few × 10−4 M⊙, i.e. orders of magnitude larger than in the thin–MH CE regime considered for the secondary. In this work we therefore considered a representative SRLOF track near the primary’s mass (we use M ≃ 0.363 M⊙ as our reference) and bracketed the impact of residual burning with two configurations: a case with Lnuc/L ≃ 0.25 (as in Althaus et al. 2013) and a case with enhanced residual burning, Lnuc/L ≃ 0.70, to illustrate how the inferred cooling age depends on the nuclear contribution. These SRLOF models are then used in Sect. 4 to interpret the primary. Over the M–Teff range of interest, the structural parameters and cooling ages predicted by these SRLOF sequences are consistent – within typical modelling differences – with independent calculations (e.g. Istrate et al. 2016). This agreement provides a useful cross-check on our radius–temperature comparison and on the cooling-age estimates for the primary.
4. Radius–temperature comparison and cooling ages
In Fig. 2 we show CE tracks at M = 0.3208 M⊙ with MH = 6.6 × 10⁻⁶ M⊙ (Althaus et al. 2025) and the two additional thin-envelope CE sequences computed here at the same mass with MH = 10−6 and 10−7 M⊙. We also include the published CE sequence at M = 0.363 M⊙ with MH = 5 × 10⁻⁶ M⊙ (Althaus et al. 2025). For comparison, we plot SRLOF models from Althaus et al. (2013) that retain MH ∼ (3–5)×10−4 M⊙ and sustain residual H burning (shown as blue dashed lines). The locations of the primary and secondary (Table 1; Antunes Amaral et al. 2024) are overplotted with their 1σ intervals in R and Teff.
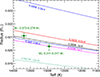 |
Fig. 2. Stellar radius (R⊙) versus Teff for He-core WD sequences with different MH. Shown are CE models at M = 0.3208 M⊙ (MH = 6.6 × 10⁻⁶, 10−6, and 10−7 M⊙) and at M = 0.363 M⊙ (MH = 5 × 10⁻⁶ M⊙) (Althaus et al. 2025), together with SRLOF tracks from Althaus et al. (2013) (blue dashed). The J2102–4145 components are shown with 1σ errors in R and Teff, including the observed mass ranges of the primary (M1) and secondary (M2) (Antunes Amaral et al. 2024). The curve annotations in the plot indicate the stellar mass and H envelope mass, in the format M:MH (both in M⊙), for each evolutionary sequence. The primary matches an SRLOF model with MH ∼ 3 × 10⁻⁴ M⊙, while the secondary requires MH ≲ 10−7 M⊙ (see text). |
The comparison reveals a clear structural dichotomy. Despite being less massive, the secondary (M2) has a slightly smaller radius than the primary (M1), contrary to the mass–radius relation expected for similar compositions. Since both stars have comparable Teff (within ∼800 K), this inversion cannot be ascribed to thermal differences and instead points to distinct envelope structures and evolutionary histories.
The secondary cannot be reproduced by the SRLOF track at its measured mass. In particular, the 0.3208 M⊙ SRLOF sequence predicts radii systematically larger than R2 at the observed Teff. Matching R2 along this track would require moving to much cooler Teff, inconsistent with the data. We therefore focus on CE models. At the secondary’s Teff, CE models predict a monotonic decrease of R with decreasing MH. The M = 0.3208 M⊙ sequences with MH = 6.6 × 10⁻⁶ and 10−6 M⊙ overpredict the measured R2 (the latter only marginally within the 1σ band), whereas the 10−7 M⊙ track matches the observed radius. This is a conservative value: at fixed Teff a slightly lower mass implies a larger radius, so using the available 0.3208 M⊙ tracks instead of a track closer to the dynamical mass mildly underestimates the model radius and would require an even thinner envelope to match R2. If M = 0.317 M⊙, the MH = 10−7 M⊙ track would pass through the upper bound of R2 (i.e., within +1σ), so our adopted MH ≲ 10−7 M⊙ remains a conservative, observationally anchored limit.
The extremely low MH implied by the secondary raises the question of whether standard BP prescriptions in CE evolution can produce such remnants. For the progenitor structure shown in Fig. 1 (a 1.5 M⊙ RGB star at Mcore = 0.3202 M⊙), the MH values associated with mcp and with the XH = 0.1 proxy are both far above what is required by R2. In fact, MH ≃ 1.0 × 10⁻⁷ M⊙ is roughly three orders of magnitude lower than the value at mcp and about sixty times smaller than the XH = 0.1 estimate (see Fig. 1). This contrast indicates that envelope removal in J2102–4145 was substantially more efficient than predicted by standard BP criteria.
The primary is well reproduced by SRLOF models that retain comparatively thick H envelopes (MH ∼ 10−4 M⊙), which inflate the radius and sustain residual H burning. In contrast, the secondary – already shown to require an extremely thin envelope of MH ≃ 1 × 10⁻⁷ M⊙ – can only be explained by nearly complete envelope removal during CE. The juxtaposition of these two cases strongly points to distinct evolutionary channels. Antunes Amaral et al. (2024) also find the primary consistent with substantial H retention using independent SRLOF grids (Istrate et al. 2016), but propose that the secondary formed first via SRLOF and the primary later through CE. Our structural analysis supports the reverse order: the primary likely formed via SRLOF, retaining a relatively massive H layer, and the secondary through a subsequent CE episode that stripped almost all of its envelope. We return to this formation sequence in Sect. 5.
Element diffusion is an unavoidable process during WD cooling, as gravitational settling reshapes the outer layers and generally increases the stellar radius at a given Teff. To assess its impact, we computed additional sequences in which the effects of element diffusion were artificially suppressed. In this case, matching the observed radius of the secondary requires a thicker H envelope, MH ∼ 6 × 10⁻⁶ M⊙–still a very thin layer compared with SRLOF remnants. This value is close to that predicted by the XH = 0.1 bifurcation criterion and, while smaller than the estimate obtained from the compression point by a factor of a few–tens, it is not orders of magnitude different.
Suppressing diffusion, however, requires invoking an additional mechanism capable of competing with the settling timescale. A plausible candidate is rotationally induced mixing. One way to estimate the associated transport is through the Eddington–Sweet circulation velocity, given by
 (1)
(1)
where Ω is the stellar angular velocity. If the secondary is synchronised with the orbit, Ω corresponds to the orbital frequency (P = 0.07 d), which provides an upper limit on the rotation rate and thus on vES. For luminous post-CE models, this yields order-of-magnitude flow speeds in the H-rich envelope that can exceed the diffusion velocities by about one to two orders of magnitude. Because vES ∝ L, the efficiency of this process decreases as the star cools, and in practice composition gradients and turbulence may further reduce the effective mixing. Nevertheless, the comparison suggests that rotationally driven transport could, in some regimes, compete with gravitational settling and modify the envelope structure.
The purpose of invoking rotation here is mainly to highlight a mechanism that could inhibit diffusion and thereby relax the constraint on the required MH. Rotation may also influence the stellar structure more directly – for instance, centrifugal support would tend to increase the stellar radius, which in turn would require thinner envelopes to match R2. Thus, envelope and core rotation could act in opposite directions regarding the inferred MH, but in all cases the required H layers remain extremely thin. A detailed assessment of these effects lies beyond the scope of this work, yet they underline the sensitivity of our inferences to rotational physics.
By contrast, tidal heating–another possible perturbation–remains negligible for orbital periods ≳1 h (e.g., Fuller & Lai 2013), and is unlikely to affect the present system given its 2.4 h nearly circular orbit (Antunes Amaral et al. 2024).
Figure 3 illustrates the Teff evolution of the reference models. For the secondary, we adopt the CE track with M = 0.3208 M⊙ and MH = 10−7 M⊙, which reaches the observed parameters after ∼220 Myr of cooling. For the primary, we relied on the representative SRLOF sequences introduced in Sect. 3.2. The case with Lnuc/L ≃ 0.25 (solid blue line; Althaus et al. 2013) reproduces the observed Teff at an age of ∼260 Myr. A variant sequence with enhanced burning, Lnuc/L ≃ 0.70 (dashed blue line), illustrates the sensitivity of the result: at the same Teff, the inferred cooling age can increase to ∼510 Myr. This should not be regarded as a firm upper limit, but rather as an indication of how strongly the age estimate depends on the contribution of residual nuclear burning. The ∼240 Myr age inferred from an independent 0.344 M⊙ sequence by Istrate et al. (2016), with a nuclear contribution of ∼30%, further supports the consistency of our adopted SRLOF models.
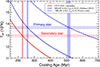 |
Fig. 3. Evolution of Teff since the end of mass loss for selected He-core WD models. The red curve shows the CE track (M = 0.3208 M⊙, MH = 10−7 M⊙) used for the secondary. Solid blue is the post-SRLOF model for the primary from Althaus et al. (2013) with residual burning Lnuc/L ≃ 0.25, and dashed blue is a variant computed here with increased residual burning (Lnuc/L ≃ 0.70) to illustrate its impact on the cooling. Coloured bars indicate the cooling ages inferred at the measured Teff of each component, with their widths obtained by propagating the observational uncertainty in Teff along the corresponding track (at fixed M and MH). |
The cooling time of the primary thus depends critically on the extent of residual burning, which in turn is set by the final envelope mass. As shown by Althaus et al. (2001), this depends on the number of CNO flashes experienced before entering the cooling track, a quantity that increases when element diffusion is included. The efficiency of diffusion in the outer H tail–where it dominates–may itself be modified by degeneracy, turbulence, or rotation-induced mixing, highlighting that the predicted residual nuclear burning, and hence the cooling age, remain sensitive to these physical uncertainties.
Because post-CE models cool faster than SRLOF sequences, and given the observed Teff values, the system configuration strongly favours the primary having formed first via SRLOF, followed by a CE episode that produced the compact secondary. This contrasts with the scenario of Antunes Amaral et al. (2024), where the more massive WD forms last via CE.
5. Formation history and evolutionary pathway of J2102–4145
The measurable age difference between the two WDs in J2102–4145 provides strong constraints on its evolution. Our models indicate that the primary – an SRLOF-formed 0.375 M⊙ He-core WD – reaches its current Teff after ∼260 Myr for a case with Lnuc/L ≃ 0.25, and after ∼510 Myr in an illustrative model with enhanced residual burning (Lnuc/L ≃ 0.70); even larger nuclear contributions would lengthen the cooling time further. The secondary – formed through a CE event – matches its properties in ∼220 Myr. Thus, the delay between the SRLOF episode and the CE event is of order a few 108 yr; within our bracketing models it lies in the range ∼40–290 Myr.
A further constraint comes from the primary’s radius. Although its mass does not exclude a C/O core (Zenati et al. 2019), such models predict a much smaller radius due to stronger Coulomb interactions in the degenerate plasma, even with the largest MH allowed after SRLOF. The observed radius is instead reproduced by a He-core model with residual burning, confirming that core He ignition was avoided. The secondary, with 0.314 M⊙, lies below the He ignition threshold, making a C/O core implausible.
Avoiding core He ignition requires a primary progenitor mass below ∼1.8 M⊙ (e.g., Han et al. 2002; Arancibia-Rojas et al. 2024). A higher mass (≳3.5–4 M⊙) could work if the envelope were lost on the main sequence, but mass transfer is then slow and unlikely to remove the envelope before the orbit widens, detaching the donor. This would demand an initial period ≲1–2 d, typical only of hierarchical triples (Tokovinin et al. 2006).
The stability of the first mass-transfer episode depends on the donor’s structure and mass ratio. Beyond the Hertzsprung gap, partially convective envelopes tend to expand during mass loss, favouring CE, but stable transfer is possible if q ≲ 1.5–2.2 (e.g., Pavlovskii & Ivanova 2015). Earlier transfer, during the main sequence or subgiant phase, allows larger q (Ge et al. 2024). Our scenario thus requires moderately constrained parameters but no extreme fine tuning.
A plausible pathway begins with SRLOF from the more massive progenitor, forming the primary with a relatively large MH. Mass transfer may increase the secondary’s mass, shortening its main-sequence lifetime and allowing it to reach the RGB and undergo CE within ∼280 Myr. For example, a 1.8 M⊙ star leaves the main sequence after ∼1600 Myr, while a 1.6 M⊙ star does so after ∼2250 Myr – too late for the required timing unless mass accretion accelerates its evolution. The retained fraction is uncertain: some studies support non-conservative transfer (e.g., Han et al. 2002, 2003; van Rensbergen et al. 2008, 2011; Erdem & Öztürk 2014; Marino et al. 2019), others predict negligible accretion due to spin-up (e.g., Vos et al. 2020), while up to 50% retention is also possible (Lechien et al. 2025).
An alternative explanation for the observed age difference is that the system began as a near-equal-mass binary, consistent with the twin peak in the mass-ratio distribution of main-sequence binaries, particularly in short-period systems (e.g., Halbwachs et al. 2003). With nearly equal masses, the first episode of SRLOF is expected to widen the orbit. If the orbit widens, the secondary would encounter a larger Roche lobe at the second interaction and would therefore need to reach a larger stellar radius to initiate mass transfer. For RGB donors, a larger radius typically implies a larger He-core mass, so this path would predict a more massive resulting WD for the secondary – contrary to the observations.
The orbital response to mass transfer depends on how mass and angular momentum are lost from the system (Vos & Vučković 2017). Mass loss from the vicinity of the donor or accretor generally leads to orbital widening, whereas losses through a circumbinary structure can extract angular momentum and cause orbital shrinkage. While such effects are discussed in the literature, they are not required to account for the properties of J2102–4145.
The different masses of the two WDs are naturally explained by the distinct timescales of the two interaction phases. Stable Roche-lobe overflow proceeds over tens of Myr, allowing the donor to continue its RGB evolution while the orbit evolves gradually and the He core grows. By contrast, the CE phase experienced by the secondary is dynamical and strips the envelope on a short timescale, with little additional core growth. As a result, the secondary can reach Roche-lobe overflow at its present orbital separation with a smaller He-core mass and end as the less massive WD, without invoking any special orbital evolution prior to the CE.
Applying the reconstruction method of Zorotovic & Schreiber (2022) to the CE event, we found that the progenitor of the less massive WD likely had a mass of ∼1.1–1.9 M⊙ and an orbital period of ∼20–60 days when filling its Roche lobe. These values match the observed masses and cooling ages, supporting the proposed scenario. Figure 4 illustrates the pathway, including both mass-transfer phases.
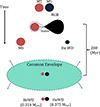 |
Fig. 4. Schematic diagram illustrating the proposed formation sequence of J2102–4145, including the two mass-transfer episodes. Stellar separations are not to scale. |
In closing, we stress that the cooling ages imply that the CE episode must have occurred within ≲200–300 Myr after the end of the first RLOF phase. This requirement can be met if the secondary progenitor is already close to the terminal-age main sequence when the primary detaches from RLOF, and/or if it is modestly rejuvenated by accretion. To illustrate the relevant evolutionary timescales, we note that in our solar-metallicity LPCODE tracks the time elapsed from the end of central H burning to the point where the He-core mass reaches ≃0.31 M⊙ is ∼300 Myr for a 1.5 M⊙ star, but decreases to ∼130 Myr for a 1.8 M⊙ star. Therefore, once the secondary has left the main sequence, reaching the RGB core mass required for the CE phase is compatible with the time window inferred from the WD cooling ages.
6. Energy budget of the common-envelope ejection
A quantitative description of the CE phase can be formulated in terms of the energy formalism (Ivanova et al. 2013), in which the orbital energy released during the spiral-in process is compared with the binding energy of the donor’s envelope. The ejection efficiency is described by the parameter αCE, defined as
 (2)
(2)
where ΔEorb is the orbital energy released between the initial (ai) and final (af) separations, and Ebind is the total binding energy of the envelope at the onset of CE.
For the J2102–4145 system, the energy analysis presented here refers to the CE episode that formed the secondary WD of M2, WD = 0.314 M⊙. At that stage, the primary was already a WD of mass M1, WD = 0.375 M⊙, while the companion was the RGB progenitor of the present-day secondary. In this section, we considered progenitor models for the secondary with zero-age main sequence masses MZAMS, 2 between 1.0 and 1.8 M⊙. The system currently has an orbital period P = 0.10020875 d, corresponding to a separation anow = 0.80190 R⊙, and a cooling age for the secondary of τcool, 2 = 220 Myr. By backward integrating the angular-momentum losses driven by gravitational radiation for a circular orbit (Peters 1964) over τcool, 2, we derived a post-CE birth separation abirth = 0.85418 R⊙, which we adopt as the final orbital separation of the CE episode (af = abirth).
The orbital energy released during the spiral-in of the RGB progenitor of the secondary around the pre-existing WD is given by
 (3)
(3)
The initial separation ai is determined from the Roche-lobe overflow condition of the RGB donor at the onset of the CE. To estimate ai, we used the photospheric radius of the star (Rphot) as a function of the mass of its H-free core and identify the point where this mass is approximately equal to the final mass of the secondary WD, M2, WD. The resulting Rphot and corresponding ai values for MZAMS, 2 = {1.0, 1.5, 1.8} M⊙ are listed in Table 2. Because ai ≫ af, the change in orbital energy is largely determined by the af term in Eq. (3).
CE summary for J2102–4145, assuming a residual H mass  that reproduces the observed radius of the secondary WD.
For the energy budget, the pre-CE boundary between the core and the ejected envelope is set by a mass coordinate mcut linked to the observed radius of the secondary WD. It is defined so that the total H mass enclosed within mcut in the pre-CE RGB model equals the H mass ( ) that, after envelope ejection, reproduces the WD radius (see Fig. 1),
 (4)
(4)
The binding energy of the outer envelope (above mcut) is then computed as
![Mathematical equation: $$ \begin{aligned} E_{\rm {bind}}(m_{\rm {cut}}) \;=\; \int _{m_{\rm {cut}}}^{M_{\rm {ZAMS}}} \left[ \frac{G\,m}{r(m)} \;-\; u_{\rm {int}}(m) \right]\,\mathrm{d}m, \end{aligned} $$](/articles/aa/full_html/2026/04/aa56862-25/aa56862-25-eq12.gif) (5)
(5)
where uint is the specific internal energy from the OPAL equation of state, which includes gas, radiation, and ionization terms appropriate to the pre-CE structure. No enthalpy contribution ( + P/ρ) or recombination energy released during the CE expansion is added. Hence, our Ebind represents a moderately conservative estimate: smaller than a purely gravitational value, but larger than those including enthalpy or recombination energy liberated during the CE expansion.
Our values of αCE, summarised in Table 2, show the expected trend with progenitor mass: more massive RGB donors have more tightly bound envelopes (higher Ebind) and thus require larger ejection efficiencies. The 1.0 M⊙ progenitor yields the smallest αCE, but it would evolve too slowly to reproduce the ∼0.2 Gyr formation delay between the two WDs. In contrast, the 1.8 M⊙ model requires αCE > 1, implying that orbital energy alone would be insufficient unless additional power sources such as jets, nuclear burning, or dynamically released recombination energy were available. The intermediate 1.5 M⊙ progenitor yields αCE ≃ 1, providing a reasonable balance between energetics and evolutionary timescales.
A broader comparison with previous CE and RLOF reconstructions reinforces this evolutionary pathway. Population studies generally recover mean efficiencies of αCE ≈ 0.3–0.5 but with substantial system–to–system dispersion and no evidence for a universal value (e.g. Zorotovic & Schreiber 2022; Chen et al. 2024; Torres et al. 2025). Zorotovic & Schreiber (2022) find moderate efficiencies in WD+BD systems, consistent with expectations for low-mass RGB donors, while Chen et al. (2024) review a wider set of post-CE binaries – including double WDs – showing that αCE depends sensitively on donor structure, mass ratio, and boundary definition. In J2102–4145, the relatively high αCE follows directly from the very deep mass cut needed to leave the secondary with an extremely thin H envelope. Reproducing MH ∼ 10−7 M⊙ requires removing tightly bound inner layers of the RGB envelope, which raises Ebind and thus αCE. The large efficiency value therefore reflects the progenitor’s structure, not an anomalous CE process. We note that the orbital periods we infer at CE onset (∼20–40 d; Table 2) agree well with the results from the independent reconstruction method of Zorotovic & Schreiber (2022), lending further support to the viability of this formation pathway.
A direct comparison can also be made with the adiabatic mass–loss reconstructions of Ge et al. (2022, 2024), where the CE evolution is followed along adiabatic sequences that track the donor’s structural readjustment under rapid mass removal while enforcing both the energy and Roche–lobe conditions. Applied mainly to sdB+WD and sdB+MS binaries, this method yields typical efficiencies of αCE ∼ 0.3, with noticeable system–to–system scatter and a dependence on donor mass and mass ratio rather than a universal value. In these models, the total H mass is integrated from the XH = 0.1 boundary outwards, giving an upper limit immediately after envelope ejection; the remnant is expected to lose additional surface H as it thermally readjusts. According to updated adiabatic grids provided by Hongwei Ge (priv. comm.), the residual H masses predicted for the parameters of J2102–4145 range between MH ∼ 3 × 10⁻⁴ and 3 × 10⁻³ M⊙ at the final orbital separation, depending on the progenitor mass and adopted efficiency. In contrast, reproducing the observed radius of the secondary WD in J2102–4145 requires an extremely thin residual envelope ( ), implying a deeper mass cut and higher Ebind than in the sdB progenitors considered by Ge et al. (2022, 2024), see later in this section. The larger αCE values inferred here are therefore consistent with their overall trends and reflect distinct structural conditions and boundary definitions rather than fundamentally different CE physics.
To quantify the additional energy required to reach a given target efficiency, we parameterised the contribution of possible extra reservoirs (e.g. partial recombination or enthalpy) as a fraction f of the reference binding energy, such that  and
and  . The fraction needed to reach a target efficiency α★ then follows from f(α★) = 1 − α★/αCE, corresponding to an extra energy Eextra = f Ebind. The corresponding f and Eextra values listed in Table 2 indicate that the 1.5 M⊙ progenitor requires only a negligible fraction (f ≃ 0.003) to achieve αCE ≃ 1, whereas reducing the efficiency to α★ = 0.5 would demand about 50% of Ebind. For the 1.8 M⊙ model, the required fractions increase to f ≃ 0.3–0.7 for the same range of α★. In contrast, the 1.0 M⊙ case already yields αCE < 1 without extra energy and needs only ∼0.14 Ebind to reach α★ = 0.5.
The potential role of recombination energy can be assessed by estimating the maximum energy reservoir available if the envelope material above the cut were to recombine completely. Assuming a representative composition (X ≃ 0.70, Y ≃ 0.28) and full recombination of H and He, the energy per unit mass is
 (6)
(6)
where mp is the proton mass and 1 eV = 1.602 × 10⁻¹² erg. The corresponding upper limit to the total recombination energy is then Erec, max ≈ ϵrecMenv ≈ 2.9 × 1046(Menv/M⊙) erg, where  (e.g. Ivanova & Nandez 2016). For the three progenitors considered here, this yields Erec, max ≃ 1.9 × 1046, 3.4 × 1046, and 4.3 × 1046 erg for MZAMS = 1.0, 1.5, and 1.8 M⊙, respectively. Comparing these values with the extra energies Eextra in Table 2 shows that recombination could, in principle, supply enough energy only in the most favourable case (1.0 M⊙, α★ = 0.5, Eextra ≃ 1.9 × 1046 erg ≈ Erec, max). For the other cases, the energy required to reach the target efficiencies (α★ = 1 or 0.5) exceeds Erec, max by factors of ∼3–6, even under idealised assumptions of complete recombination and perfect energy trapping. In realistic CE conditions, partial recombination, energy leakage, and compositional gradients would further reduce the effective contribution. Therefore, except for the lowest-mass progenitor, recombination alone is unlikely to provide the additional energy needed to lower αCE without violating the constraint on the thin H envelope.
Figure 5 illustrates the dependence of the CE efficiency on the residual H mass in the secondary WD. For all three progenitor models, αCE flattens into a nearly constant plateau for log MH ≲ −6.5, corresponding to the regime constrained by the observed radius of the secondary (grey band). In this range, the values of αCE coincide with those listed in Table 2, showing that the derived efficiencies are essentially insensitive to the exact choice of the residual H mass as long as it remains within the observationally allowed interval. At larger MH, αCE decreases monotonically because the binding energy becomes smaller when the envelope cut is placed further out in mass.
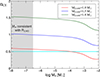 |
Fig. 5. CE efficiency as a function of the residual H mass in the secondary WD. The grey band marks the range compatible with the observed radius of the secondary, log MH ≤ −6.5. |
The stability criteria and RLOF reconstructions of Ge et al. (2024) provide a useful framework to place in context the formation of the primary WD. Figure 4 of Ge et al. (2024) shows that stable, largely non–conservative mass transfer on the RGB naturally produces He–core remnants with MWD ≃ 0.30 M⊙ for binaries with initial orbital periods of ∼60 d. Because the P–MWD relation in this mass range is set mainly by the core mass–radius relation of the RGB donor and depends only weakly on MZAMS, slightly longer initial periods are expected to yield correspondingly more massive remnants. In this context, the 0.375 M⊙ primary in J2102–4145 can be naturally interpreted as the outcome of stable RGB mass transfer in a system with an initial period moderately longer than the fiducial ∼60 d case illustrated by Ge et al. (2024).
The observed ∼0.2 Gyr cooling–age difference between the two WDs is also compatible with this channel. In particular, the post–RLOF orbital separation must allow the secondary to reach a CE phase within the required timescale, which disfavours both fully conservative transfer – leading to excessively wide orbits – and fully non–conservative extremes, which would tend to produce lighter remnants or reduce the likelihood of CE survival. While a detailed quantitative reconstruction is beyond the scope of this work, these considerations indicate that the first mass–transfer episode cannot lie at either extreme and is likely to have been neither fully conservative nor fully non–conservative.
7. Conclusions
The eclipsing double WD system J2102–4145 provides a unique empirical test of H-envelope retention and the outcome of envelope ejection in low-mass CE events. From the observed parameters, both components are unambiguously He-core WDs. C/O cores are excluded: the primary’s radius cannot be reproduced by any C/O-core model at the observed Teff, and the secondary’s mass (0.314 M⊙) is below the He ignition threshold.
Our analysis reveals a clear structural dichotomy. The less massive secondary (0.314 M⊙) has a slightly smaller radius than the primary (0.375 M⊙), a reversal of the expected mass–radius trend that cannot be explained by the modest ∼800 K temperature difference. This contrast is explained by the primary retaining a substantial H envelope, while the secondary has undergone nearly complete stripping. Reproducing the latter’s radius requires MH ≲ 10−7 M⊙, far below the values predicted by standard bifurcation criteria. This difference shows that envelope removal in J2102–4145 penetrated much more deeply than predicted by standard prescriptions. Rotational mixing could, in principle, moderate the role of diffusion and affect the inferred envelope mass, but the requirement of an extremely thin MH remains robust.
We propose a formation sequence in which the primary formed first via SRLOF, producing a He-core WD with a relatively large H envelope, and the secondary subsequently formed through a CE episode that stripped almost all of its envelope. Cooling ages support this scenario: the secondary is matched by a thin-envelope CE track with a cooling age of ∼220 Myr, while the primary is consistent with SRLOF models that retain thick H layers, yielding ages of ∼260 Myr in our reference case and up to ∼510 Myr in an illustrative sequence with enhanced residual burning (Lnuc/L ≃ 0.70). Even larger nuclear contributions would further lengthen the cooling time. The resulting age gap, of order a few 108 yr (within ∼40–290 Myr in our bracketing models), agrees with the proposed sequence where SRLOF precedes CE. Independent constraints on the formation geometry indicate that the progenitor of the less massive WD had a mass of ∼1.1–1.9 M⊙ and an orbital period of ∼20–60 d at CE onset, consistent with the proposed SRLOF → CE formation pathway.
Our CE energy analysis clarifies why the event that formed the secondary must have removed the envelope to unusually deep layers. The extremely small residual H mass required by the observed radius (MH ≃ 10−7 M⊙) forces a mass cut far below the usual bifurcation criteria, resulting in a strongly bound remnant envelope and the correspondingly large αCE values obtained in our models. In contrast, adiabatic mass–loss reconstructions predict post–CE H layers that are orders of magnitude larger, underscoring that J2102–4145 probes an exceptionally stripped regime of low–mass CE evolution. Nevertheless, this extreme outcome fits naturally within the proposed SRLOF → CE formation sequence once the observational constraint on MH is imposed.
J2102–4145 thus constitutes a benchmark for CE physics in the low-mass white-dwarf regime, providing direct evidence of highly efficient envelope stripping and placing stringent limits on post-CE H retention. Its precisely measured parameters offer one of the strongest observational challenges to standard prescriptions, and future discoveries of similar systems will be essential to establish whether such extreme cases are unusual or common outcomes of compact-binary evolution.
Acknowledgments
We thank the anonymous referee for a constructive and insightful report that helped improve this manuscript. We are also deeply grateful to Hongwei Ge for his kindness in sharing details of his adiabatic mass–loss calculations and providing updated results for direct comparison with our models. We are grateful to Yossef Zenati for kindly providing helpful input during the preparation of this work. We also thank Helena Mainetti for her help in preparing the figures. MZ and MV acknowledge support from FONDECYT (grant 1250525). LGA, ARM and ST acknowledge support from MINECO under the PID2023-148661NB-I00 grant and by the AGAUR/Generalitat de Catalunya grant SGR-386/2021. This research has made use of NASA Astrophysics Data System.
References
- Althaus, L. G., & Córsico, A. H. 2022, A&A, 663, A167 [NASA ADS] [CrossRef] [EDP Sciences] [Google Scholar]
- Althaus, L. G., Serenelli, A. M., & Benvenuto, O. G. 2001, MNRAS, 323, 471 [Google Scholar]
- Althaus, L. G., Serenelli, A. M., Panei, J. A., et al. 2005, A&A, 435, 631 [NASA ADS] [CrossRef] [EDP Sciences] [Google Scholar]
- Althaus, L. G., Córsico, A. H., Isern, J., & García-Berro, E. 2010, A&A Rev., 18, 471 [NASA ADS] [CrossRef] [Google Scholar]
- Althaus, L. G., Miller Bertolami, M. M., & Córsico, A. H. 2013, A&A, 557, A19 [NASA ADS] [CrossRef] [EDP Sciences] [Google Scholar]
- Althaus, L. G., Camisassa, M. E., Miller Bertolami, M. M., Córsico, A. H., & García-Berro, E. 2015, A&A, 576, A9 [NASA ADS] [CrossRef] [EDP Sciences] [Google Scholar]
- Althaus, L. G., Calcaferro, L. M., Córsico, A. H., & Brown, W. R. 2025, A&A, 699, A280 [NASA ADS] [CrossRef] [EDP Sciences] [Google Scholar]
- Antunes Amaral, L., Munday, J., Vučković, M., et al. 2024, A&A, 685, A9 [NASA ADS] [CrossRef] [EDP Sciences] [Google Scholar]
- Arancibia-Rojas, E., Zorotovic, M., Vučković, M., et al. 2024, MNRAS, 527, 11184 [Google Scholar]
- Brown, W. R., Kilic, M., Kosakowski, A., et al. 2020, ApJ, 889, 49 [Google Scholar]
- Brown, A. J., Parsons, S. G., van Roestel, J., et al. 2023, MNRAS, 521, 1880 [NASA ADS] [CrossRef] [Google Scholar]
- Cassisi, S., & Salaris, M. 2013, Old Stellar Populations: How to Study the Fossil Record of Galaxy Formation (Wiley-VCH) [Google Scholar]
- Chen, X., Liu, Z., & Han, Z. 2024, Prog. Part. Nucl. Phys., 134, 104083 [Google Scholar]
- Erdem, A., & Öztürk, O. 2014, MNRAS, 441, 1166 [Google Scholar]
- Fuller, J., & Lai, D. 2013, MNRAS, 430, 274 [NASA ADS] [CrossRef] [Google Scholar]
- Ge, H., Tout, C. A., Chen, X., et al. 2022, ApJ, 933, 137 [NASA ADS] [CrossRef] [Google Scholar]
- Ge, H., Tout, C. A., Webbink, R. F., et al. 2024, ApJ, 961, 202 [NASA ADS] [CrossRef] [Google Scholar]
- Halbwachs, J. L., Mayor, M., Udry, S., & Arenou, F. 2003, A&A, 397, 159 [NASA ADS] [CrossRef] [EDP Sciences] [Google Scholar]
- Han, Z., Podsiadlowski, P., & Eggleton, P. P. 1994, MNRAS, 270, 121 [NASA ADS] [CrossRef] [Google Scholar]
- Han, Z., Podsiadlowski, P., Maxted, P. F. L., Marsh, T. R., & Ivanova, N. 2002, MNRAS, 336, 449 [Google Scholar]
- Han, Z., Podsiadlowski, P., Maxted, P. F. L., & Marsh, T. R. 2003, MNRAS, 341, 669 [NASA ADS] [CrossRef] [Google Scholar]
- Istrate, A. G., Marchant, P., Tauris, T. M., et al. 2016, A&A, 595, A35 [NASA ADS] [CrossRef] [EDP Sciences] [Google Scholar]
- Ivanova, N. 2011, ApJ, 730, 76 [Google Scholar]
- Ivanova, N., & Nandez, J. L. A. 2016, MNRAS, 462, 362 [NASA ADS] [CrossRef] [Google Scholar]
- Ivanova, N., Justham, S., Chen, X., et al. 2013, A&A Rev., 21, 59 [NASA ADS] [CrossRef] [Google Scholar]
- Kosakowski, A., Brown, W. R., Kilic, M., et al. 2023, ApJ, 950, 141 [CrossRef] [Google Scholar]
- Kruckow, M. U., Tauris, T. M., Langer, N., et al. 2016, A&A, 596, A58 [NASA ADS] [CrossRef] [EDP Sciences] [Google Scholar]
- Lechien, T., de Mink, S. E., Valli, R., et al. 2025, ApJ, 990, L51 [Google Scholar]
- Li, Z., Chen, X., Chen, H.-L., & Han, Z. 2019, ApJ, 871, 148 [NASA ADS] [CrossRef] [Google Scholar]
- Lombardi, J. C., Jr, Proulx, Z. F., Dooley, K. L., et al. 2006, ApJ, 640, 441 [Google Scholar]
- Marino, A., Di Salvo, T., Burderi, L., et al. 2019, A&A, 627, A125 [NASA ADS] [CrossRef] [EDP Sciences] [Google Scholar]
- Marsh, T. R., Dhillon, V. S., & Duck, S. R. 1995, MNRAS, 275, 828 [Google Scholar]
- Miller Bertolami, M. M. 2016, A&A, 588, A25 [NASA ADS] [CrossRef] [EDP Sciences] [Google Scholar]
- Pavlovskii, K., & Ivanova, N. 2015, MNRAS, 449, 4415 [Google Scholar]
- Peters, P. C. 1964, Phys. Rev., 136, 1224 [Google Scholar]
- Rebassa-Mansergas, A., Nebot Gómez-Morán, A., Schreiber, M. R., Girven, J., & Gänsicke, B. T. 2011, MNRAS, 413, 1121 [NASA ADS] [CrossRef] [Google Scholar]
- Salaris, M., Althaus, L. G., & García-Berro, E. 2013, A&A, 555, A96 [NASA ADS] [CrossRef] [EDP Sciences] [Google Scholar]
- Tauris, T. M., & Dewi, J. D. M. 2001, A&A, 369, 170 [NASA ADS] [CrossRef] [EDP Sciences] [Google Scholar]
- Tokovinin, A., Thomas, S., Sterzik, M., & Udry, S. 2006, A&A, 450, 681 [NASA ADS] [CrossRef] [EDP Sciences] [Google Scholar]
- Torres, S., Gili, M., Rebassa-Mansergas, A., et al. 2025, A&A, 698, A173 [NASA ADS] [CrossRef] [EDP Sciences] [Google Scholar]
- van Rensbergen, W., De Greve, J. P., De Loore, C., & Mennekens, N. 2008, A&A, 487, 1129 [NASA ADS] [CrossRef] [EDP Sciences] [Google Scholar]
- van Rensbergen, W., de Greve, J. P., Mennekens, N., Jansen, K., & de Loore, C. 2011, A&A, 528, A16 [NASA ADS] [CrossRef] [EDP Sciences] [Google Scholar]
- Vigna-Gómez, A., Wassink, M., Klencki, J., et al. 2022, MNRAS, 511, 2326 [CrossRef] [Google Scholar]
- Vos, J., & Vučković, M. 2017, Open Astron., 26, 275 [Google Scholar]
- Vos, J., Bobrick, A., & Vučković, M. 2020, A&A, 641, A163 [NASA ADS] [CrossRef] [EDP Sciences] [Google Scholar]
- Woosley, S. E., & Heger, A. 2015, ApJ, 810, 34 [NASA ADS] [CrossRef] [Google Scholar]
- Zenati, Y., Toonen, S., & Perets, H. B. 2019, MNRAS, 482, 1135 [NASA ADS] [CrossRef] [Google Scholar]
- Zorotovic, M., & Schreiber, M. 2022, MNRAS, 513, 3587 [NASA ADS] [CrossRef] [Google Scholar]
All Tables
CE summary for J2102–4145, assuming a residual H mass that reproduces the observed radius of the secondary WD.
All Figures
|
Fig. 1. Internal structure of a 1.5 M⊙ pre-CE RGB star at the epoch when the H-free core is 0.3202 M⊙ (plotted versus the Lagrangian mass coordinate mr). Shown are the H abundance by mass, XH(mr), and the cumulative H mass interior to mr, MH(< mr), which increases outwards. Vertical dashed lines mark the BP criteria (XH = 0.1, peak nuclear energy generation, and maximum compression). The dashed green line marks MH = 1.0 × 10⁻⁷ M⊙, the H content inferred for the secondary of J2102–4145 from the observed (R, Teff). The plot shows only the innermost envelope layers of the RGB progenitor, which set the residual H content. |
| In the text | |
|
Fig. 2. Stellar radius (R⊙) versus Teff for He-core WD sequences with different MH. Shown are CE models at M = 0.3208 M⊙ (MH = 6.6 × 10⁻⁶, 10−6, and 10−7 M⊙) and at M = 0.363 M⊙ (MH = 5 × 10⁻⁶ M⊙) (Althaus et al. 2025), together with SRLOF tracks from Althaus et al. (2013) (blue dashed). The J2102–4145 components are shown with 1σ errors in R and Teff, including the observed mass ranges of the primary (M1) and secondary (M2) (Antunes Amaral et al. 2024). The curve annotations in the plot indicate the stellar mass and H envelope mass, in the format M:MH (both in M⊙), for each evolutionary sequence. The primary matches an SRLOF model with MH ∼ 3 × 10⁻⁴ M⊙, while the secondary requires MH ≲ 10−7 M⊙ (see text). |
| In the text | |
|
Fig. 3. Evolution of Teff since the end of mass loss for selected He-core WD models. The red curve shows the CE track (M = 0.3208 M⊙, MH = 10−7 M⊙) used for the secondary. Solid blue is the post-SRLOF model for the primary from Althaus et al. (2013) with residual burning Lnuc/L ≃ 0.25, and dashed blue is a variant computed here with increased residual burning (Lnuc/L ≃ 0.70) to illustrate its impact on the cooling. Coloured bars indicate the cooling ages inferred at the measured Teff of each component, with their widths obtained by propagating the observational uncertainty in Teff along the corresponding track (at fixed M and MH). |
| In the text | |
|
Fig. 4. Schematic diagram illustrating the proposed formation sequence of J2102–4145, including the two mass-transfer episodes. Stellar separations are not to scale. |
| In the text | |
|
Fig. 5. CE efficiency as a function of the residual H mass in the secondary WD. The grey band marks the range compatible with the observed radius of the secondary, log MH ≤ −6.5. |
| In the text | |
Current usage metrics show cumulative count of Article Views (full-text article views including HTML views, PDF and ePub downloads, according to the available data) and Abstracts Views on Vision4Press platform.
Data correspond to usage on the plateform after 2015. The current usage metrics is available 48-96 hours after online publication and is updated daily on week days.
Initial download of the metrics may take a while.