Fig. 5.
Download original image
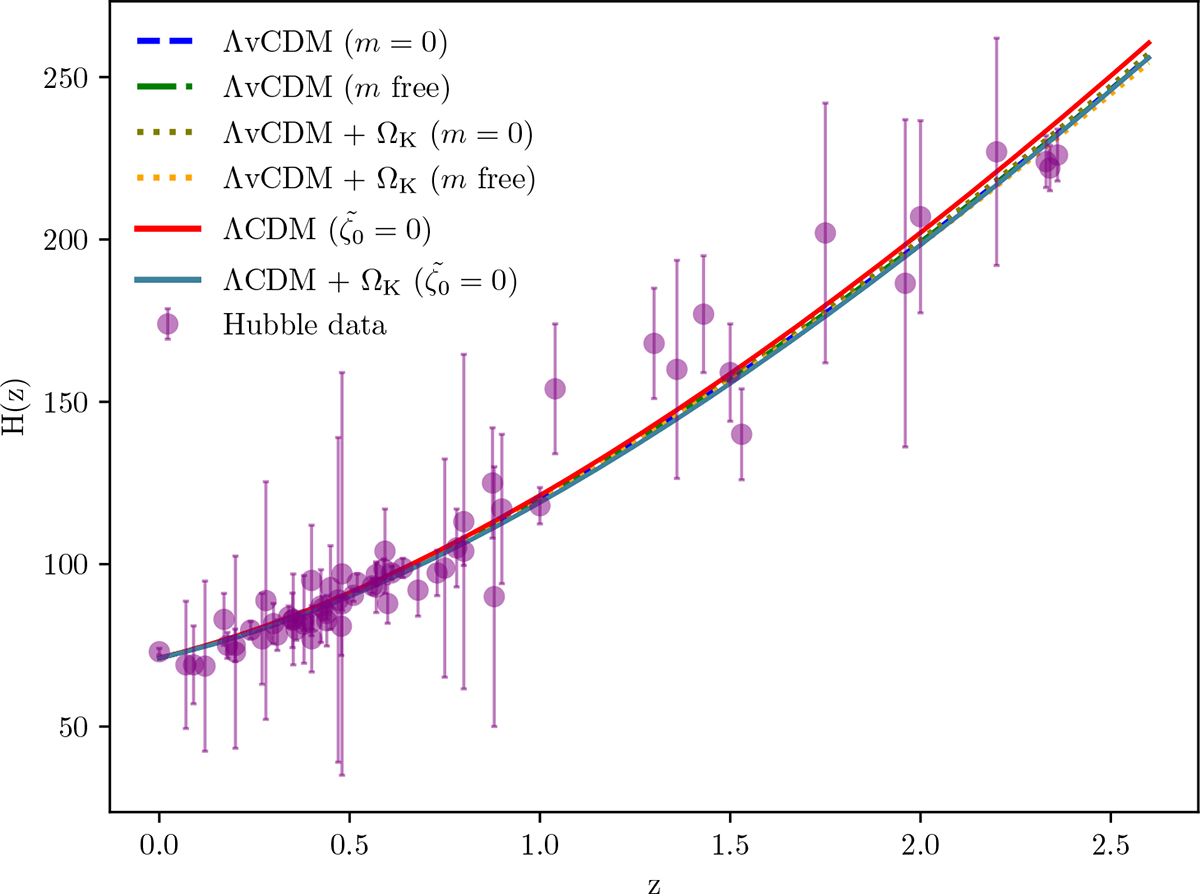
Evolution of Hubble function H(z) with redshift z. Comparison between OHD (purple points with error bars; 0 < z < 2.36) and theoretical predictions. The solid red and green lines corresponds to the ΛCDM and ΛCDM + ΩK models, respectively. The dashed, dash-dotted, and dotted lines correspond to the ΛvCDM and ΛvCDM + ΩK models. The parameters constrained by the Base 2 + CC + R22 dataset.
Current usage metrics show cumulative count of Article Views (full-text article views including HTML views, PDF and ePub downloads, according to the available data) and Abstracts Views on Vision4Press platform.
Data correspond to usage on the plateform after 2015. The current usage metrics is available 48-96 hours after online publication and is updated daily on week days.
Initial download of the metrics may take a while.