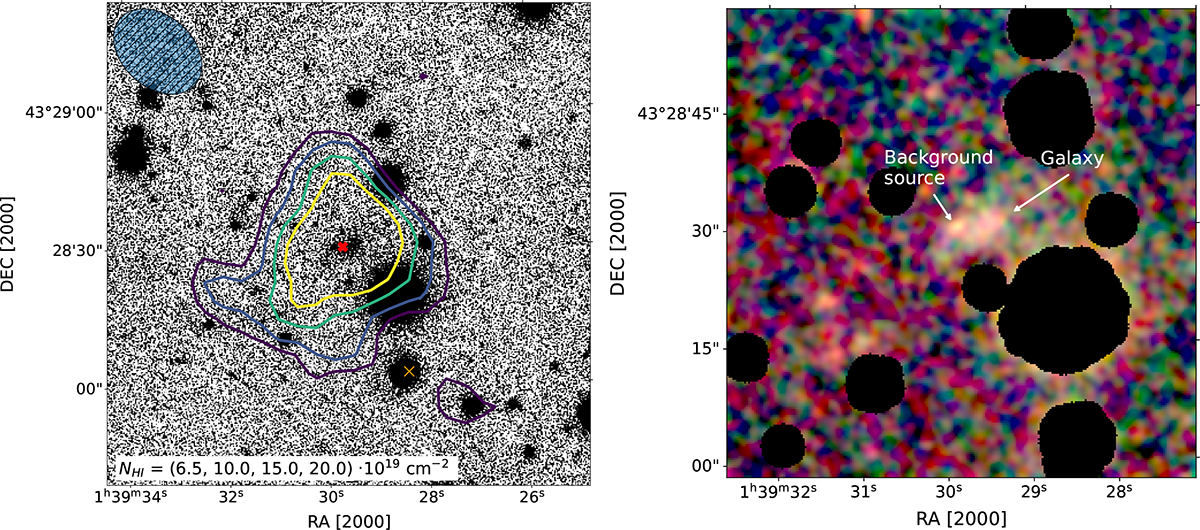
Fig. 1.
Download original image
Identification of the optical counterpart. Left: H I contours on optical image obtained by stacking PS1 g, r, and i-band images. The H I contours are [6.5, 10, 15, 20] × 1019 atoms cm−2, where the lowest contour is ∼2-σ. The thick red cross marks the VLA centroid, while the thin orange cross marks the FAST centroid from X23. Right: Color image of the galaxy from g (blue), r (green), and i-bands (red), smoothed by a Gaussian kernel of 2 pixels. Masked areas are in black.
Current usage metrics show cumulative count of Article Views (full-text article views including HTML views, PDF and ePub downloads, according to the available data) and Abstracts Views on Vision4Press platform.
Data correspond to usage on the plateform after 2015. The current usage metrics is available 48-96 hours after online publication and is updated daily on week days.
Initial download of the metrics may take a while.