| Issue |
A&A
Volume 708, April 2026
|
|
|---|---|---|
| Article Number | A40 | |
| Number of page(s) | 9 | |
| Section | Extragalactic astronomy | |
| DOI | https://doi.org/10.1051/0004-6361/202556900 | |
| Published online | 26 March 2026 | |
Not so-dark: High resolution H I imaging of J0139+4328 and identification of an optical counterpart
1
ASTRON, Netherlands Institute for Radio Astronomy, Oude Hoogeveensedijk 4, 7991 PD, Dwingeloo, The Netherlands
2
Kapteyn Astronomical Institute, University of Groningen, Postbus 800, 9700 AV, Groningen, The Netherlands
3
Department of Space, Earth and Environment, Chalmers University of Technology, Onsala Space Observatory, 43992 Onsala, Sweden
4
National Astronomical Observatories, Chinese Academy of Sciences, Beijing 100101, PR China
5
Guizhou Radio Astronomical Observatory, Guizhou University, Guiyang 550000, PR China
6
CAS Key Laboratory of FAST, National Astronomical Observatories, Chinese Academy of Sciences, Beijing 100101, PR China
★ Corresponding author: This email address is being protected from spambots. You need JavaScript enabled to view it.
Received:
18
August
2025
Accepted:
16
January
2026
Abstract
Dark galaxies – systems rich in neutral hydrogen (H I) gas but with no stars – are a common prediction of numerous theoretical models and cosmological simulations. However, the unequivocal identification of such sources in current H I surveys has proven challenging. In this work, we present interferometric follow-up observations with the Karl G. Jansky Very Large Array (VLA) of a former dark galaxy candidate J0139+4328, originally detected with the single-dish FAST telescope. The improved spatial resolution of the VLA data allows us to identify a faint optical counterpart and characterize the galaxy. Located at a distance of about 31 Mpc, J0139+4328 has a stellar mass of 3 × 10⁶ M⊙ and a relatively high gas richness of MHI/M* = 18. Despite its high ratio, the galaxy is consistent, within the scatter, with the stellar-to-H I mass relation of H I-selected samples in the literature and with the baryonic Tully–Fisher relation (BTFR), although its kinematic measurement is subject to large uncertainties. This case highlights the potential of modern high-sensitivity H I surveys for detecting low surface brightness and gas-rich galaxies, but underscores the need for careful interpretation of low-resolution H I data, with potentially large centroid errors, and for sufficiently deep optical imaging to ensure robust identification.
Key words: galaxies: dwarf / galaxies: formation / galaxies: fundamental parameters / galaxies: ISM / galaxies: stellar content
© The Authors 2026
 Open Access article, published by EDP Sciences, under the terms of the Creative Commons Attribution License (https://creativecommons.org/licenses/by/4.0), which permits unrestricted use, distribution, and reproduction in any medium, provided the original work is properly cited.
This article is published in open access under the Subscribe to Open model. This email address is being protected from spambots. You need JavaScript enabled to view it. to support open access publication.
1. Introduction
The search for dark galaxies, that is, galaxies containing gas but no stars, has been of interest for many decades, dating back to early surveys of the neutral hydrogen (H I) content of galaxies (e.g., Pisano et al. 2002; Doyle et al. 2005; Davies et al. 2006). Theoretically, these systems are thought to be dark matter halos in which neutral gas could not reach the critical density required to trigger star formation. This is attributed to a combination of poor cooling efficiency in low-metallicity environments and suppression of gas collapse due to cosmic ultraviolet (UV) background radiation (e.g., Kepner et al. 1997). Some analytic models (e.g., Davies et al. 2006; Benitez-Llambay & Frenk 2020) and cosmological simulations (e.g., Benítez-Llambay et al. 2017; Lee et al. 2024) predict the existence of such systems and provide further insight into their evolution. In particular, Lee et al. (2024) found that dark galaxies in the Illustris TNG50 simulation (Vogelsberger et al. 2014; Nelson et al. 2015) tend to reside in dark matter halos with slightly higher spin parameters, have larger gas and dark matter sizes compared to luminous systems of similar mass, and are found in lower-density regions where reduced numbers of interactions allow them to persist without merging with luminous systems. Finding such systems in observations serves as a direct test of current theoretical models compared to predictions from simulations.
While the existence of dark galaxies is theoretically anticipated, there are very few convincing dark galaxy candidates to date. Numerous H I-rich but optically faint or undetected sources have been identified in untargeted H I surveys such as the Arecibo Legacy Fast ALFA (ALFALFA, Giovanelli et al. 2005) and the FAST all sky H I survey (FASHI, Zhang et al. 2024). However, most previous candidates were later revealed to be more likely remnants of tidal interactions or gas stripping (e.g., VIRGOHI21, Bekki et al. 2005; Taylor et al. 2017; SECCO 1, Bellazzini et al. 2015a,b, 2018). Some of the most promising current candidates include HI 1225+01 (Giovanelli & Haynes 1989; Chengalur et al. 1995; Matsuoka et al. 2012), AGESVC1 282 (Taylor et al. 2012, 2013; Bílek et al. 2020), Cloud 9 (Zhou et al. 2023; Benitez-Llambay & Navarro 2023; Benítez-Llambay et al. 2024), and AC G185.0−11.5 (Liu et al. 2025). However, all of the above candidates are close to another galaxy or belong to a cluster, complicating their interpretations. The lack of truly isolated candidates questions the existence of these systems and/or their detectability with current H I surveys. Recent untargeted H I surveys such as the APERture Tile In Focus (Apertif, van Cappellen et al. 2022; Adams et al. 2022) and the Widefield ASKAP L-band Legacy All-sky Blind surveY (WALLABY, Koribalski et al. 2020) are continuing to expand the search for such systems, with some candidates already proposed (with WALLABY, O’Beirne et al. 2025), which, however, have yet to be confirmed.
Despite the scarcity of unequivocal dark galaxies, deep H I surveys have uncovered a variety of systems that are extremely gas rich and underluminous. These include low-mass galaxies with unusually high gas richness (e.g., Coma P, Janowiecki et al. 2015; AGC 229101, Leisman et al. 2021), and ultra-diffuse galaxies (UDGs), galaxies of low surface brightnesses (μ > 24 mag arcsec−2) but large physical sizes (Re > 1.5 kpc; e.g., Leisman et al. 2017; Mancera Piña et al. 2019; Šiljeg et al. 2024). Together, these objects define a broader regime of interest in galaxy evolution: probing the physical conditions under which dark matter halos can accumulate baryons and the circumstances in which those baryons fail to form stars efficiently. The study of such galaxies offers a promising path to refine models of gas accretion, cooling, and feedback in low-mass systems (e.g., Somerville & Davé 2015).
In this work, we report follow-up observations of a galaxy that was initially discovered with FAST and reported by Xu et al. (2023, hereafter X23) as a dark galaxy candidate. Using interferometric H I observations from the Karl G. Jansky Very Large Array (VLA), we were able to refine the position of the H I emission and identify the faint optical counterpart in the Pan-STARRS1 (PS1) data (Chambers et al. 2016). The system remains underluminous, with a log (MHI/LV) of 0.94, comparable to UDGs (Leisman et al. 2017; Mancera Piña et al. 2019; Janowiecki et al. 2019; Leisman et al. 2021), but at lower masses. Compared with larger samples of H I-selected galaxies, we find that J0139+4328 is not an outlier from the MHI − M* scaling relation, although it lies in a relatively unexplored regime of dwarf galaxies with low stellar mass and high gas richness. This case highlights the challenges of associating optical counterparts with H I detections from low-resolution single-dish surveys, particularly at larger distances where the optical counterpart is expected to be faint in existing large-scale optical surveys.
In Sect. 2, we describe the VLA observations and ground-based imaging data. In Sect. 3, we derive and report the global H I and optical properties of the galaxy, and compare them with previous H I detections of the galaxy with FAST. We report on the environment of J0139+4328 and place it in the context of other H I detected galaxies in Sect. 4. Finally, in Sect. 5, we provide our conclusions and considerations for future studies of dark galaxies.
2. Data
2.1. Resolved H I observations
Our target J0139+4328 was observed with the Karl G. Jansky VLA in D-configuration using exploratory time under the program 23A-424. The observations were made in four blocks of three hours each on December 20, 21, 22, and 27, 2023, with 8.8 hours in total on J0139+4328. In addition, observations using the C-array configuration were made under project 25A-251 on July 29, 30 and August 2, 10 of 2025 with a total on-target observing time of 11.7 h. In all observations, the flux and bandpass calibrator 3C48 was observed for 15 minutes at the start of each observing block. J0139+4328 was observed as a set of 15-minute scans interleaved with 5-minute scans on the secondary calibrator J0136+4751. The spectral setup consisted of an 8 MHz bandwidth with 1024 channels giving a channel width of 7.81 kHz corresponding to 1.65 km s−1 (radio convention). The data were flagged for minor radio frequency interference and standard cross-calibrations using the primary and the phase calibrators were applied to the target data. No self-calibration was performed. Data from both D and C-array configurations were combined and imaged with a robust weighting of −0.5 and a channel width of 1.65 km s−1. Hanning smoothing was applied to the data cube, resulting in a velocity resolution of 3.3 km s−1. The continuum was subtracted by fitting a straight line through the line-free channels. The noise level of the spectral line cube is a 0.64 mJy beam−1 and the beam size is  (position angle
  ). This gives a 3-σ column density sensitivity of 3.8 × 1019 cm−2 for a line width of 10 km s−1. The line cube was initially cleaned without a mask down to five times the noise level. The result of this was smoothed to twice the spatial resolution and with a 5-channel wide Hanning function in velocity. A mask was created from this smoothed cube using a clip level of twice the noise level of this lower-resolution cube. The original line cube was then cleaned using this mask down to a level of half the noise level.
After determining the systemic velocity of the source (Sect. 3.2), we transferred the cube to the rest frame of the source using
 (1)
(1)
where νsys is the systemic frequency of the source, νobs the observed frequency of the spectral line emission, and c the speed of light. The channel width and spectral resolution in this rest frame become 1.66 km s−1 and 3.33 km s−1, respectively. All H I properties of J0139+4328 and all plots showing the H I emission are given in the rest frame of the source.
2.2. Pan-STARRS1
We used PS1 data (Chambers et al. 2016) to characterize the stellar counterpart, as this is the only optical photometric survey with publicly available data in this region. PS1 is a broadband photometric survey conducted using the 1.8-meter telescope located at the Haleakalā Observatory in Hawaii. We use the PS1 cutout service to obtain 3.3′×3.3′ images in the g-, r-, and i-bands centered at the H I centroid position (see Sect. 3.2). The median seeings in g-, r-, and i-bands are estimated by Gaussian fits to foreground stars and are equal to 1.27″, 1.11″, and 1.03″, respectively.
3. Properties of J0139+4328
In this section, we derive the H I and optical properties of J0139+4328. All derived quantities can be found in Table 1, while the methods are reported below.
Properties of J0139+4328.
3.1. Distance
We derive the velocity-based distance to J0139+4328 using the calculators1 provided by the Extragalactic Distance Database (Kourkchi et al. 2020). We use the numerical action method (NAM) model from Shaya et al. (2017), which is more precise for small distances (the model extends to ∼38 Mpc). J0139+4328 has a heliocentric optical recessional velocity of 2484 km s−1, corresponding to a velocity of 2651 km s−1 in the Galactic standard of the rest frame (Eq. 4 from Kourkchi et al. 2020). The NAM model gives a distance of (31.03 ± 5.4) Mpc, where the error is estimated using the prescription from Haubner et al. (2025).
3.2. H I properties
We construct the moment zero map by collapsing all channels with visually identified emission (in the heliocentric rest frame and optical convention this corresponds to 2459.1−2509.4 km s−1; channel maps are shown in Appendix A). Figure 1 shows the moment zero map overlaid on an optical image, with the peak emission clearly situated on top of an optical counterpart. We convert to column densities (NHI) using
 (2)
(2)
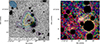 |
Fig. 1. Identification of the optical counterpart. Left: H I contours on optical image obtained by stacking PS1 g, r, and i-band images. The H I contours are [6.5, 10, 15, 20] × 1019 atoms cm−2, where the lowest contour is ∼2-σ. The thick red cross marks the VLA centroid, while the thin orange cross marks the FAST centroid from X23. Right: Color image of the galaxy from g (blue), r (green), and i-bands (red), smoothed by a Gaussian kernel of 2 pixels. Masked areas are in black. |
where SHI is the total H I flux and θmin and θmaj are the full widths at half maximum (FWHM) of the minor and major axes of the beam, respectively. The H I centroid is determined by fitting a 2D Gaussian to the innermost 24″ × 24″ region of the galaxy. We obtain the position of 01h39m29.7s +43d28m30s, offset by 31″ from the X23 position obtained with FAST. The moment zero map is then smoothed to 30″ resolution and clipped at 3-σ to define a mask for the original resolution H I cube, then applied to each channel. This procedure includes faint emission into the mask and has been shown to robustly recover the total H I flux of a marginally resolved H I source (Oosterloo et al. 2013; Adams & Oosterloo 2018). Figure 2 shows the global spectrum within this mask. We fit a Gaussian function to derive the H I properties of the source (Table 1). The systemic velocity in the heliocentric rest frame and optical convention corresponds to 2483.5 km s−1. All other H I properties are derived in the rest frame of the source, and correspond to: velocity width of the global profile at 50% of the peak value (W50) of 28.5 km s−1 and total flux of 259 mJy km s−12. At a distance of 31.03 Mpc (Sect. 3.1) the derived H I mass of J0139+4328 is 5.9 × 10⁷ M⊙. Its peak column density, at a resolution of 16″ × 22″ is 3.5 × 10²⁰ atoms cm−2.
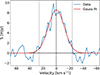 |
Fig. 2. VLA global H I profile of J0139+4328 in the rest frame of the source. Dotted lines indicate the extent used for creating the moment zero map and the dashed line denotes the determined systemic velocity. |
Figure 3 shows the moment one map, created over the same channel range as the moment zero map, with a mask applied based on a 5σ (1.6 × 1020 cm−2) threshold in the moment zero map, to retain only high-significance emission. As apparent from the white isovelocity contours, there is a velocity gradient across the source indicating the presence of a rotating disk. This gradient also shows the potential signature of a warp, evident from the change in position angle (measured counterclockwise from the north) from 150° in the center to 190° in the outskirts. We extract multiple position-velocity (PV) slices at position angles between 100°–280°. In Fig. 4, we show a PV slice at a position angle of 150°, which shows a clear gradient in velocity. We see no sign of flat rotation in any of the PV slices. Furthermore, as J0139+4328 is marginally resolved, the W50 is perfectly consistent with the extent of the high S/N (∼4σ) emission in all extracted PV slices. Hence, we estimate the rotation velocity of J0139+4328 using W50.
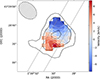 |
Fig. 3. Moment one map with total intensity H I contours at [3, 5, 10]-σ overlaid in black. White contours are iso-velocity contours separated by 2 km s−1. Full gray lines denote the area from which the position-velocity slice in Fig. 4 was extracted. |
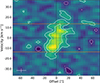 |
Fig. 4. Position-velocity slice at the PA = 150°. Data contours are shown in white at [2, 4]-σ with full (dashed) lines denoting positive (negative) emission. Horizontal orange lines denote the W50 spread. In the lower left corner, we denote the beam size (horizontal line) and velocity resolution (vertical line). |
We correct the W50 using standard prescriptions for instrumental (Verheijen & Sancisi 2001) and thermal broadening (Tully & Fouque 1985; Verheijen & Sancisi 2001) that have been specifically calibrated for W50 measurements on spatially resolved galaxies. We assume the contribution from thermal velocity dispersion of  km s−1, a common value found in dwarf galaxies (de Blok & Walter 2006; Stilp et al. 2013). The projected rotational velocity after the above corrections is found to be (10.2 ± 2.2) km s−1.
As we cannot determine H I geometry of J0139+4328 due to insufficient spatial resolution, we employ optical geometry for the inclination correction of the rotational velocity. However, we note that the optical position angle does not seem to be fully aligned3 with the kinematic position angle (with ∼22−62° difference for PAkin 150−190°), making the following estimate potentially uncertain. In addition, a warp may introduce a systematic uncertainty in the rotational velocity estimate, which could be biased toward lower values if the outer disk (assuming it dominates the W50 measurement) is warped to a lower inclination than the inner disk. However, the presence and magnitude of this effect are difficult to estimate given the limited spatial resolution of the data. Taking the optically determined inclination of 56° (Sect. 3.4), we obtain a rotational velocity of Vrot = (12.3 ± 2.8) km s−1.
3.3. Comparison of H I properties between VLA and FAST
As mentioned in Sect. 1, the galaxy was initially detected with FAST and reported in X23 as a dark galaxy. Additionally, there is another FAST detection of the source within the FASHI catalog (hereafter FASHI detection, Zhang et al. 2024). In this section, we compare the obtained H I properties of the VLA detection with the two detections from FAST. As X23 reported their H I measurements in the heliocentric rest frame and the radio velocity convention, we converted our quantities to the same convention and rest frame for a consistent comparison.
The H I centroid of the X23 (FASHI) detection is 31″ (13″) in the southern direction offset from the VLA one. The relatively large offset between the X23 centroid and the VLA one (which is positioned on top of the optical counterpart) is attributed to the centroiding error of the FAST telescope4 and was likely the reason for the misinterpretation of the galaxy as a dark H I cloud. The systemic velocities determined in X23 (2464.4 km s−1) and reported in FASHI (2462.8 km s−1) are well consistent with the VLA estimate of 2463.1 km s−1. The total flux of the X23 detection is 424 mJy km s−1; 1.6 times higher than the VLA flux of 259 mJy km s−1. On the other hand, the flux from the FASHI catalog amounts to only 256 mJy km s−1 (well within 1σ of the VLA flux). Looking at the global profile, the X23 profile peaks at a higher value of ∼12 mJy, while the VLA and the FASHI detections both peak at ∼9 mJy. Furthermore, when comparing the shapes of the X23 and the VLA profiles, the VLA spectrum falls off more quickly toward lower velocities, corresponding to the approaching part of the galaxy. Consequently, the W50 is higher for the X23 detection (38.9 km s−1) compared to the VLA (28.2 km s−1), while the W50 of the FASHI detection is between those two with 35.1 km s−1. With the same peak value, but a larger W50, the FASHI detection likely has a more similar shape to the X23 detection, but is scaled toward lower fluxes, in line with the VLA flux.
While there are dissimilarities between all H I measurements of J0139+4328, we cannot conclusively determine whether their origin5 is due to differences in spatial resolution, column density sensitivity, or overall calibration of the H I data. However, it is clear that the source is at most marginally resolved in all of these detections at their respective column density sensitivities. Deeper H I data with at least the same resolution as the VLA and column density sensitivities of FAST (∼1018 cm−2) are needed to truly tackle the observed differences between different detections, as well as to robustly characterize the source in terms of its kinematic properties and the morphology of the H I disk.
3.4. Optical properties
In this section, we describe our photometric measurements and the derivation of the stellar mass estimate for J0139+4328. We note that there is a red background source coincident with the galaxy, as seen in the right panel of Fig. 1, although offset sufficiently from the center to still enable reliable photometry. We masked this source together with foreground stars before estimating the galaxy’s geometry using isophotal fitting. We employed the isophotal fitting procedure described in Šiljeg et al. (2024). In short, we fit the i-band image using the Astropy affiliated package photutils (Bradley et al. 2022) twice, the first time constraining the position of the center and the second time constraining the position angle and ellipticity. We smoothed the i-band image with a 3 pixel smoothing kernel before fitting to increase S/N. We took the median value of each parameter within the region outside the FWHM of the smoothed point spread function (PSF) and the surface brightness limit of 27 mag/arcsec2 (below this limit, the geometry is highly influenced by noise in the image). The optical geometry obtained is given in Table 1, and the fitted model is shown in Fig. 5.
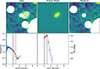 |
Fig. 5. Isophotal fitting. Upper panels: The left panel displays the smoothed image with overlaid ellipses whose corresponding parameters are indicated by red stars in the lower panels. Masked regions appear in white. The central panel presents the model reconstructed from all fitted ellipses whose parameters are shown as blue circles in the bottom panels, while the right panel shows the residual obtained by subtracting the model from the data image. Lower panels: Ellipticity and position angle as functions of the semi-major axis length from the second iteration of the fitting procedure. Blue points represent all fitted ellipses from this run, and red stars correspond to those displayed in the upper left panel. The vertical black line indicates the radius equivalent to the PSF’s FWHM after smoothing, and the shaded gray area marks the region used to determine the overall geometry (by taking the median within this range). |
Due to the faintness and the small size of the source, we prefer to use fixed aperture photometry instead of a fitted model. Aperture photometry was performed on full spatial resolution images using the optical geometry obtained and a semi-major axis extent of 12″. As seen in Fig. 6, the 12″ aperture incorporates all the visible flux from the galaxy. For confirmation, we have experimented with smaller (6″ and 9″) and larger extents (15″ and 18″), confirming that the obtained magnitudes tend to be fainter in the former case (indicating that some galaxy emission has likely been excluded), and compatible with the chosen extent in the latter (no additional emission was included). For example, a 9″ aperture resulted in systematically ∼0.14 fainter magnitudes, while a 15″ aperture yielded magnitudes consistent within 1.5σ. An elliptical annulus of the same shape with semi-major axes from 18″–24″ was used for a local sky background subtraction. The errors in magnitude are estimated by placing the same aperture in 12 positions without any sources in the image and repeating the same procedure. The standard deviation of these values was used as the error estimate for the magnitude obtained. We measured photometry using masked images and report the results in Table 1. We note that the flux within the 12″ aperture of an unmasked image (keeping the same background level measured from the masked image) gave fully compatible results within the 1σ error.
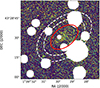 |
Fig. 6. Aperture photometry on the masked image in the r-band. The red ellipse corresponds to the 12″ (along the semi-major axis) aperture in which the magnitude was measured, while dashed white ellipses denote the annulus within which the background level was estimated at semi-major axes of 18″–24″. |
Correcting for Galactic extinction from Schlafly & Finkbeiner (2011) and using the mass-to-light ratio – (g − r) color relation from Herrmann et al. (2016), we find a stellar mass of 3.2 × 10⁶ M⊙6, reported in Table 1. Furthermore, if we transfer to the V-band magnitude using the filter transformations of Tonry et al. (2012), we obtain the V-band luminosity of LV = −12.28. This gives a log(MHI/LV) of 0.94, a value closely comparable to the UDG values (∼0.2 − 1), and significantly larger than the median of the ALFALFA-SDSS sample (∼ − 0.3; Durbala et al. 2020; Leisman et al. 2021).
4. Discussion
4.1. Environment of J0139+4328
We searched for the closest known galaxy to J0139+4328 within a systemic velocity difference of 1000 km s−1 using the NASA/IPAC Extragalactic Database7 (NED). The closest neighbor to J0139+4328 is NGC 620, with an angular separation of 1.24° and a nearly identical recessional velocity of 2507 km s−1 (separated by only 23 km s−1, Theureau et al. 1998). At a distance of 31.03 Mpc, that corresponds to a projected separation of 671 kpc. NGC 620 is included by Karachentsev et al. (2011) in their isolated nearby galaxy sample (“local orphan galaxies” or LOGs). For a distance of 31.03 Mpc, the stellar mass of NGC 620 is 2.7 × 10⁹ M⊙ (Leroy et al. 2019). Based on abundance matching, NGC 620 has a halo mass of 1.9 × 10¹¹ M⊙ (Behroozi et al. 2010). This halo has a virial radius of around 155 kpc (assuming the over-density parameter of Δ = 300), much smaller than the projected separation of 671 kpc from J0139+4328. Thus, J0139+4328 is very unlikely to be a satellite galaxy or a tidal dwarf, making it highly probable that its properties (e.g., its large gas richness) are intrinsic to the galaxy.
4.2. Scaling relations
Although initially proposed as a dark galaxy, we have now confirmed the presence of a faint stellar counterpart. Given the low stellar content, we wish to understand if this is a typical dwarf galaxy, simply selected via H I emission and lying near the detection threshold of current optical surveys for its stellar mass and distance, or if it represents an unusual dwarf galaxy, indicative of new populations we might find with advancing H I surveys.
We first look at the MHI − M* relation, shown in Fig. 7. We plot the ALFALFA-SDSS catalog (Durbala et al. 2020) for context. We also plot a subsample of the Survey of H I in Extremely Low-mass Dwarfs (SHIELD, McQuinn et al. 2021), a sample selected from the ALFALFA survey with H I mass MHI ≲ 107.2 M⊙. We include two samples of UDGs as potential analogs of optically faint and gas rich galaxies at higher stellar masses: edge-on H I-bearing UDGs (He et al. 2019) and UDGs from Gault et al. (2021), both selected from the ALFALFA survey. We also add Leo P (Giovanelli et al. 2013; McQuinn et al. 2024) and Leo T (Irwin et al. 2007; Simon & Geha 2007; Ryan-Weber et al. 2008) as local H I-rich faint dwarf galaxies for context. Finally, we add a low surface brightness dwarf galaxy in the Dorado group (LSBG-Dorado-A) which we refer to as LSB-D (Maccagni et al. 2024) and Pavo (Jones et al. 2023, 2025), one of the lowest-baryonic mass-H I-rich galaxies known outside the Local Group so far.
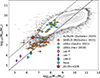 |
Fig. 7. MHI vs. M* relation. The full black line denotes the 1:1 relation (gas richness of 1), and the dashed line denotes the 1:18 relation (gas richness of 18). |
J0139+4328 has a stellar mass similar to the SHIELD sample and the LSB-D, but is significantly gas richer, falling into a regime that has not been well studied before at high resolution. This regime is naturally excluded from SHIELD due to the upper H I mass limit in their selection, and is also excluded from UDG selections due to the small intrinsic sizes of such low stellar mass objects. With a gas richness (MHI/M*) of 18, J0139+4328 is significantly more gas rich than our local faint dwarfs Leo P and Leo T, and is instead in the regime of UDG galaxy samples, but is an order of magnitude smaller in mass. It would therefore be interesting to explore whether J0139+4328 could be a low-mass counterpart to H I-rich UDGs, that is, having lower surface brightness and larger effective radii compared to its similar mass dwarfs, using deep optical imaging. Finally, while J0139+4328 is gas rich for its stellar mass, it is not a significant outlier from the relation traced by the ALFALFA-SDSS catalog, which is naturally biased toward gas-rich systems at these masses.
Next, we look at the BTFR. The BTFR connects the baryonic mass of the galaxy to the circular velocity of its dark matter halo, and is one of the tightest scaling relations for late-type galaxies. Interestingly, the H I-rich UDGs have been shown to be systematically offset from this relation, having lower circular velocities compared to galaxies of similar baryonic content (Mancera Piña et al. 2019, 2020). We therefore investigate whether J0139+4328 follows this trend and shares dynamical properties with H I-rich UDGs, or if it aligns more closely with the scaling relations of typical dwarf galaxies.
The BTFR is shown in Fig. 8. We plot various samples from the literature for context. We take 123 galaxies from the SPARC sample (Lelli et al. 2016) with reliable rotation curves (quality flags Q = 1 or 2) and inclinations greater than 25°, excluding three galaxies that are part of the LITTLE THINGS subsample. The LITTLE THINGS subsample with 17 galaxies comes from Iorio et al. (2017), which has a more detailed analysis (based on the 3D modeling of the whole data cube). In addition, we incorporated a subsample of 16 galaxies from the SHIELD survey with published velocity measurements (McNichols et al. 2016; McQuinn et al. 2022). We also include two sets of UDGs: a sample of six systems from Mancera Piña et al. (2019, 2020, including the updated velocity for AGC 114905 from Mancera Piña et al. 2024), and a sample of 11 edge-on UDGs from He et al. (2019).
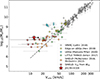 |
Fig. 8. Position of J0139+4328 on the BTFR. The dash-dotted black line is the best-fit model to the SPARC sample from Lelli et al. (2016). |
All of the above samples (except the edge-on UDGs from He et al. 2019) are based on spatially well resolved H I measurements (making them more reliable for tracing the true Vrot). Furthermore, all resolved H I rotation curves (except the SHIELD subsample of McNichols et al. 2016) were corrected for the asymmetric drift, thereby obtaining the circular speed of the system Vcirc. For a more consistent comparison with the marginally resolved J0139+4328 for which such detailed analysis is impossible, we additionally overplot the same SHIELD galaxies again, this time applying the same procedure for Vrot estimation we used for J0139+4328 (see Sect. 3.2; from W50 reported in the ALFALFA catalog and with the same inclinations used for their resolved Vrot estimates). We note that in five galaxies our assumed thermal broadening of 8 km s−1 (together with instrumental broadening) could explain the whole ALFALFA W50 measurement, leaving no space for rotation. Hence, we cannot estimate the rotation velocity using our method in these cases and we leave them out of this analysis.
J0139+4328 has a lower rotational velocity compared to spatially resolved measurements of galaxies with similar baryonic mass. However, after applying the same procedure for Vrot estimation to the SHIELD sample, we see that many galaxies move toward lower rotational velocities, in the regime similar to J0139+4328. In addition, we are not tracing the flat part of the rotation curve, and our inclination correction is potentially uncertain due to the slight misalignment between the kinematic and optical position angles. Hence, although J0139+4328 exhibits potentially similar properties to UDGs, we cannot discern its exact position in the BTFR based on our data.
5. Conclusions and future considerations
In this work, we have presented the follow-up VLA H I observations of J0139+4328, a former dark galaxy candidate originally detected with the single-dish FAST telescope (X23). The VLA centroid is 31″ offset from the FAST detection and is situated on top of a faint optical counterpart. Although J0139+4328 is optically faint, it does not seem to be a significant outlier from the stellar-to-H I mass relation traced by the ALFALFA-SDSS sample nor the BTFR when the scatter is taken into account (although the kinematic measurement is too uncertain to support strong conclusions). It does, however, populate a parameter space of low stellar mass with high gas richness, which has not been well studied before and could potentially exhibit similar properties to UDGs.
This case highlights the importance of a cautious interpretation of current state-of-the-art single-dish H I data. In the example of J0139+4328, a galaxy of 3 × 10⁶ M⊙ in stellar mass detected at a distance of 31 Mpc, it is clear that the FAST H I surveys are outstripping optical surveys in sensitivity to low-mass, low surface brightness, gas-rich galaxies. The claim of J0139+4328 as a dark galaxy highlights the importance of care in interpreting the shallow optical data when comparing to the deep but low-resolution FAST data. This case demonstrates that single-dish H I data require a meticulous search for the optical counterpart within the centroiding error of the telescope and even beyond, as also seen for some of the detections from ALFALFA (Cannon et al. 2015). Hence, in cases such as the one of J0139+4328, interferometric follow-ups might be crucial for a robust identification of the optical counterpart.
The identification of an optical counterpart to the FAST H I detection highlights that there are very few truly “dark” systems for the sensitivities of surveys to date. Most “dark” H I detections are tidal debris and even those often have optical counterparts with deep enough optical data (e.g., the ALFALFA Virgo 7 cloud complex, Jones et al. 2024; or the WALLABY J103508–283427, O’Beirne et al. 2024). As ongoing and upcoming future H I surveys push to fainter sensitivities, a “dark” space may await discovery but requires optical data of a matching sensitivity for robust claims. The “almost” dark galaxies present an exciting discovery in and of themselves, especially as new H I observations probe lower column densities, allowing us to explore whether gas disks can persist in more diffuse and tenuous states.
Acknowledgments
We thank the anonymous referee for valuable comments that helped improve this manuscript. This work has received funding from the European Research Council (ERC) under the Horizon Europe research and innovation programme (Acronym: FLOWS, Grant number: 101096087). KMH acknowledges financial support from the grant CEX2021-001131-S funded by MCIN/AEI/10.13039/501100011033 from the coordination of the participation in SKA-SPAIN funded by the Ministry of Science and Innovation (MCIN); and from grant PID2021-123930OB-C21 funded by MCIN/AEI/10.13039/501100011033 by “ERDF A way of making Europe” and by the “European Union”. KMH acknowledges funding from the ERC under the European Union’s Seventh Framework Programme (FP/2007–2013)/ERC Grant Agreement No. 291531 (‘HIStoryNU’). JLX and MZ acknowledge the support of the National Key R&D Program of China No. 2022YFA1602901. This work is also supported by the Youth Innovation Promotion Association of CAS, the National Natural Science Foundation of China (grant No. 11933011), the Central Government Funds for Local Scientific and Technological Development (No. XZ202201YD0020C), and supported by the Open Project Program of the Key Laboratory of FAST, NAOC, Chinese Academy of Sciences. The National Radio Astronomy Observatory and Green Bank Observatory are facilities of the U.S. National Science Foundation operated under cooperative agreement by Associated Universities, Inc. The Pan-STARRS1 Surveys (PS1) have been made possible through contributions of the Institute for Astronomy, the University of Hawaii, the Pan-STARRS Project Office, the Max-Planck Society and its participating institutes, the Max Planck Institute for Astronomy, Heidelberg and the Max Planck Institute for Extraterrestrial Physics, Garching, The Johns Hopkins University, Durham University, the University of Edinburgh, Queen’s University Belfast, the Harvard-Smithsonian Center for Astrophysics, the Las Cumbres Observatory Global Telescope Network Incorporated, the National Central University of Taiwan, the Space Telescope Science Institute, the National Aeronautics and Space Administration under Grant No. NNX08AR22G issued through the Planetary Science Division of the NASA Science Mission Directorate, the National Science Foundation under Grant No. AST-1238877, the University of Maryland, and Eotvos Lorand University (ELTE). This work made use of Astropy (http://www.astropy.org): a community-developed core Python package and an ecosystem of tools and resources for astronomy (Astropy Collaboration 2013, 2018, 2022). This research made use of Photutils, an Astropy package for detection and photometry of astronomical sources (Bradley et al. 2023). This work made use of SpectralCube (DOI: 10.5281/zenodo.591639). This research has made use of the NASA/IPAC Extragalactic Database (NED), which is operated by the Jet Propulsion Laboratory, California Institute of Technology, under contract with the National Aeronautics and Space Administration.
References
- Adams, E. A. K., & Oosterloo, T. A. 2018, A&A, 612, A26 [NASA ADS] [CrossRef] [EDP Sciences] [Google Scholar]
- Adams, E. A. K., Adebahr, B., de Blok, W. J. G., et al. 2022, A&A, 667, A38 [NASA ADS] [CrossRef] [EDP Sciences] [Google Scholar]
- Astropy Collaboration (Robitaille, T. P., et al.) 2013, A&A, 558, A33 [NASA ADS] [CrossRef] [EDP Sciences] [Google Scholar]
- Astropy Collaboration (Price-Whelan, A. M., et al.) 2018, AJ, 156, 123 [Google Scholar]
- Astropy Collaboration (Price-Whelan, A. M., et al.) 2022, ApJ, 935, 167 [NASA ADS] [CrossRef] [Google Scholar]
- Behroozi, P. S., Conroy, C., & Wechsler, R. H. 2010, ApJ, 717, 379 [Google Scholar]
- Bekki, K., Koribalski, B. S., & Kilborn, V. A. 2005, MNRAS, 363, L21 [NASA ADS] [CrossRef] [Google Scholar]
- Bellazzini, M., Beccari, G., Battaglia, G., et al. 2015a, A&A, 575, A126 [NASA ADS] [CrossRef] [EDP Sciences] [Google Scholar]
- Bellazzini, M., Magrini, L., Mucciarelli, A., et al. 2015b, ApJ, 800, L15 [NASA ADS] [CrossRef] [Google Scholar]
- Bellazzini, M., Armillotta, L., Perina, S., et al. 2018, MNRAS, 476, 4565 [Google Scholar]
- Benitez-Llambay, A., & Frenk, C. 2020, MNRAS, 498, 4887 [CrossRef] [Google Scholar]
- Benitez-Llambay, A., & Navarro, J. F. 2023, ApJ, 956, 1 [Google Scholar]
- Benítez-Llambay, A., Navarro, J. F., Frenk, C. S., et al. 2017, MNRAS, 465, 3913 [Google Scholar]
- Benítez-Llambay, A., Dutta, R., Fumagalli, M., & Navarro, J. F. 2024, ApJ, 973, 61 [Google Scholar]
- Bílek, M., Müller, O., Vudragović, A., & Taylor, R. 2020, A&A, 642, L10 [EDP Sciences] [Google Scholar]
- Bradley, L., Sipőcz, B., Robitaille, T., et al. 2022, https://doi.org/10.5281/zenodo.7419741 [Google Scholar]
- Bradley, L., Sipőcz, B., Robitaille, T., et al. 2023, https://doi.org/10.5281/zenodo.1035865 [Google Scholar]
- Cannon, J. M., Martinkus, C. P., Leisman, L., et al. 2015, AJ, 149, 72 [NASA ADS] [CrossRef] [Google Scholar]
- Chambers, K. C., Magnier, E. A., Metcalfe, N., et al. 2016, ArXiv e-prints [arXiv:1612.05560] [Google Scholar]
- Chengalur, J. N., Giovanelli, R., & Haynes, M. P. 1995, AJ, 109, 2415 [Google Scholar]
- Davies, J. I., Disney, M. J., Minchin, R. F., Auld, R., & Smith, R. 2006, MNRAS, 368, 1479 [Google Scholar]
- de Blok, W. J. G., & Walter, F. 2006, AJ, 131, 363 [Google Scholar]
- Doyle, M. T., Drinkwater, M. J., Rohde, D. J., et al. 2005, MNRAS, 361, 34 [NASA ADS] [CrossRef] [Google Scholar]
- Durbala, A., Finn, R. A., Crone Odekon, M., et al. 2020, AJ, 160, 271 [NASA ADS] [CrossRef] [Google Scholar]
- Gault, L., Leisman, L., Adams, E. A. K., et al. 2021, ApJ, 909, 19 [NASA ADS] [CrossRef] [Google Scholar]
- Giovanelli, R., & Haynes, M. P. 1989, ApJ, 346, L5 [Google Scholar]
- Giovanelli, R., Haynes, M. P., Kent, B. R., et al. 2005, AJ, 130, 2598 [Google Scholar]
- Giovanelli, R., Haynes, M. P., Adams, E. A. K., et al. 2013, AJ, 146, 15 [NASA ADS] [CrossRef] [Google Scholar]
- Haubner, K., Lelli, F., Di Teodoro, E., et al. 2025, A&A, 696, A185 [NASA ADS] [CrossRef] [EDP Sciences] [Google Scholar]
- He, M., Wu, H., Du, W., et al. 2019, ApJ, 880, 30 [NASA ADS] [CrossRef] [Google Scholar]
- Herrmann, K. A., Hunter, D. A., Zhang, H.-X., & Elmegreen, B. G. 2016, AJ, 152, 177 [NASA ADS] [CrossRef] [Google Scholar]
- Iorio, G., Fraternali, F., Nipoti, C., et al. 2017, MNRAS, 466, 4159 [NASA ADS] [Google Scholar]
- Irwin, M. J., Belokurov, V., Evans, N. W., et al. 2007, ApJ, 656, L13 [NASA ADS] [CrossRef] [Google Scholar]
- Janowiecki, S., Leisman, L., Józsa, G., et al. 2015, ApJ, 801, 96 [NASA ADS] [CrossRef] [Google Scholar]
- Janowiecki, S., Jones, M. G., Leisman, L., & Webb, A. 2019, MNRAS, 490, 566 [NASA ADS] [CrossRef] [Google Scholar]
- Jones, M. G., Mutlu-Pakdil, B., Sand, D. J., et al. 2023, ApJ, 957, L5 [Google Scholar]
- Jones, M. G., Janowiecki, S., Dey, S., et al. 2024, ApJ, 966, L15 [Google Scholar]
- Jones, M. G., Rey, M. P., Sand, D. J., et al. 2025, ApJ, 990, 164 [Google Scholar]
- Karachentsev, I. D., Makarov, D. I., Karachentseva, V. E., & Melnyk, O. V. 2011, Astrophys. Bull., 66, 1 [Google Scholar]
- Kepner, J. V., Babul, A., & Spergel, D. N. 1997, ApJ, 487, 61 [Google Scholar]
- Koribalski, B. S., Staveley-Smith, L., Westmeier, T., et al. 2020, Ap&SS, 365, 118 [Google Scholar]
- Kourkchi, E., Courtois, H. M., Graziani, R., et al. 2020, AJ, 159, 67 [NASA ADS] [CrossRef] [Google Scholar]
- Lee, G., Hwang, H. S., Lee, J., Shin, J., & Song, H. 2024, ApJ, 962, 129 [Google Scholar]
- Leisman, L., Haynes, M. P., Janowiecki, S., et al. 2017, ApJ, 842, 133 [NASA ADS] [CrossRef] [Google Scholar]
- Leisman, L., Rhode, K. L., Ball, C., et al. 2021, AJ, 162, 274 [NASA ADS] [CrossRef] [Google Scholar]
- Lelli, F., McGaugh, S. S., & Schombert, J. M. 2016, AJ, 152, 157 [Google Scholar]
- Leroy, A. K., Sandstrom, K. M., Lang, D., et al. 2019, ApJS, 244, 24 [Google Scholar]
- Liu, X.-L., Xu, J.-L., Jiang, P., et al. 2025, Sci. Adv., 11, eads4057 [Google Scholar]
- Maccagni, F. M., de Blok, W. J. G., Mancera Piña, P. E., et al. 2024, A&A, 690, A69 [NASA ADS] [CrossRef] [EDP Sciences] [Google Scholar]
- Mancera Piña, P. E., Fraternali, F., Adams, E. A. K., et al. 2019, ApJ, 883, L33 [CrossRef] [Google Scholar]
- Mancera Piña, P. E., Fraternali, F., Oman, K. A., et al. 2020, MNRAS, 495, 3636 [Google Scholar]
- Mancera Piña, P. E., Golini, G., Trujillo, I., & Montes, M. 2024, A&A, 689, A344 [NASA ADS] [CrossRef] [EDP Sciences] [Google Scholar]
- Matsuoka, Y., Ienaka, N., Oyabu, S., Wada, K., & Takino, S. 2012, AJ, 144, 159 [NASA ADS] [CrossRef] [Google Scholar]
- McNichols, A. T., Teich, Y. G., Nims, E., et al. 2016, ApJ, 832, 89 [NASA ADS] [CrossRef] [Google Scholar]
- McQuinn, K. B. W., Telidevara, A. K., Fuson, J., et al. 2021, ApJ, 918, 23 [Google Scholar]
- McQuinn, K. B. W., Adams, E. A. K., Cannon, J. M., et al. 2022, ApJ, 940, 8 [NASA ADS] [CrossRef] [Google Scholar]
- McQuinn, K. B. W., Newman, M. J. B., Skillman, E. D., et al. 2024, ApJ, 976, 60 [Google Scholar]
- Mitrašinović, A., Grozdanović, M., Lalović, A., et al. 2026, A&A, 705, L9 [NASA ADS] [CrossRef] [EDP Sciences] [Google Scholar]
- Nelson, D., Pillepich, A., Genel, S., et al. 2015, Astron. Comput., 13, 12 [Google Scholar]
- O’Beirne, T., Staveley-Smith, L., Wong, O. I., et al. 2024, MNRAS, 528, 4010 [Google Scholar]
- O’Beirne, T., Staveley-Smith, L., Kilborn, V. A., et al. 2025, PASA, 42, e087 [Google Scholar]
- Oosterloo, T. A., Heald, G. H., & de Blok, W. J. G. 2013, A&A, 555, L7 [NASA ADS] [CrossRef] [EDP Sciences] [Google Scholar]
- Pisano, D. J., Wilcots, E. M., & Liu, C. T. 2002, ApJS, 142, 161 [Google Scholar]
- Ryan-Weber, E. V., Begum, A., Oosterloo, T., et al. 2008, MNRAS, 384, 535 [NASA ADS] [CrossRef] [Google Scholar]
- Schlafly, E. F., & Finkbeiner, D. P. 2011, ApJ, 737, 103 [Google Scholar]
- Shaya, E. J., Tully, R. B., Hoffman, Y., & Pomarède, D. 2017, ApJ, 850, 207 [NASA ADS] [CrossRef] [Google Scholar]
- Šiljeg, B., Adams, E. A. K., Fraternali, F., et al. 2024, A&A, 692, A217 [NASA ADS] [CrossRef] [EDP Sciences] [Google Scholar]
- Simon, J. D., & Geha, M. 2007, ApJ, 670, 313 [NASA ADS] [CrossRef] [Google Scholar]
- Somerville, R. S., & Davé, R. 2015, ARA&A, 53, 51 [Google Scholar]
- Stilp, A. M., Dalcanton, J. J., Warren, S. R., et al. 2013, ApJ, 765, 136 [NASA ADS] [CrossRef] [Google Scholar]
- Taylor, R., Davies, J. I., Auld, R., & Minchin, R. F. 2012, MNRAS, 423, 787 [NASA ADS] [CrossRef] [Google Scholar]
- Taylor, R., Davies, J. I., Auld, R., Minchin, R. F., & Smith, R. 2013, MNRAS, 428, 459 [NASA ADS] [CrossRef] [Google Scholar]
- Taylor, R., Davies, J. I., Jáchym, P., et al. 2017, MNRAS, 467, 3648 [Google Scholar]
- Theureau, G., Bottinelli, L., Coudreau-Durand, N., et al. 1998, A&AS, 130, 333 [NASA ADS] [CrossRef] [EDP Sciences] [Google Scholar]
- Tonry, J. L., Stubbs, C. W., Lykke, K. R., et al. 2012, ApJ, 750, 99 [Google Scholar]
- Tully, R. B., & Fouque, P. 1985, ApJS, 58, 67 [Google Scholar]
- van Cappellen, W. A., Oosterloo, T. A., Verheijen, M. A. W., et al. 2022, A&A, 658, A146 [NASA ADS] [CrossRef] [EDP Sciences] [Google Scholar]
- Verheijen, M. A. W., & Sancisi, R. 2001, A&A, 370, 765 [NASA ADS] [CrossRef] [EDP Sciences] [Google Scholar]
- Vogelsberger, M., Genel, S., Springel, V., et al. 2014, Nature, 509, 177 [Google Scholar]
- Xu, J.-L., Zhu, M., Yu, N., et al. 2023, ApJ, 944, L40 [NASA ADS] [CrossRef] [Google Scholar]
- Zhang, C.-P., Zhu, M., Jiang, P., et al. 2024, Sci. China Phys. Mech. Astron., 67, 219511 [NASA ADS] [CrossRef] [Google Scholar]
- Zhou, R., Zhu, M., Yang, Y., et al. 2023, ApJ, 952, 130 [CrossRef] [Google Scholar]
This value is obtained by integrating the fitted Gaussian function and is perfectly consistent with the value obtained by integrating the data between −25.7 and 34.1 km s−1 where the spectrum is above zero.
Beam smearing in H I observations might be shifting the observed PAkin to higher values in the inner parts due to the presence of the warp. Hence, it is possible that H I observations with improved spatial resolution would find PAkin in the central part to be consistent with the optical one.
As shown for the FASHI catalog in Figure 9 of Zhang et al. 2024, the centroiding error of the FAST telescope peaks at ∼20″ with a tail towards higher values, so the offset of 31″ found in this work is not a significant outlier.
Differences in flux measurements are unlikely to result from the VLA’s interferometric short-spacing problem, since the maximum angular extent of the source in the X23 detection (∼6′) is well below the spatial scales at which the VLA begins to lose sensitivity (10−12′, set by the 35.5 m minimum baseline in the C configuration).
During the reviewing process of this paper, Mitrašinović et al. (2026) published another detection of the optical counterpart of J0139+4328 identified using deep optical imaging. The stellar mass estimate obtained in their work is fully consistent with that reported here.
Appendix A: Channel maps
In Fig. A.1 we show the channel maps of the VLA detection containing emission from the galaxy.
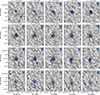 |
Fig. A.1. Channel maps of the VLA detection in the rest frame of the source. Blue contours represent the data, with dark blue lines denoting positive emission and light dashed blue lines the negative. Contours are plotted starting from 3 times the noise in the cube (0.65 mJy beam−1), and are spaced by a factor of 2 in intensity. The black X indicates the H I centroid of the galaxy. |
All Tables
All Figures
|
Fig. 1. Identification of the optical counterpart. Left: H I contours on optical image obtained by stacking PS1 g, r, and i-band images. The H I contours are [6.5, 10, 15, 20] × 1019 atoms cm−2, where the lowest contour is ∼2-σ. The thick red cross marks the VLA centroid, while the thin orange cross marks the FAST centroid from X23. Right: Color image of the galaxy from g (blue), r (green), and i-bands (red), smoothed by a Gaussian kernel of 2 pixels. Masked areas are in black. |
| In the text | |
|
Fig. 2. VLA global H I profile of J0139+4328 in the rest frame of the source. Dotted lines indicate the extent used for creating the moment zero map and the dashed line denotes the determined systemic velocity. |
| In the text | |
|
Fig. 3. Moment one map with total intensity H I contours at [3, 5, 10]-σ overlaid in black. White contours are iso-velocity contours separated by 2 km s−1. Full gray lines denote the area from which the position-velocity slice in Fig. 4 was extracted. |
| In the text | |
|
Fig. 4. Position-velocity slice at the PA = 150°. Data contours are shown in white at [2, 4]-σ with full (dashed) lines denoting positive (negative) emission. Horizontal orange lines denote the W50 spread. In the lower left corner, we denote the beam size (horizontal line) and velocity resolution (vertical line). |
| In the text | |
|
Fig. 5. Isophotal fitting. Upper panels: The left panel displays the smoothed image with overlaid ellipses whose corresponding parameters are indicated by red stars in the lower panels. Masked regions appear in white. The central panel presents the model reconstructed from all fitted ellipses whose parameters are shown as blue circles in the bottom panels, while the right panel shows the residual obtained by subtracting the model from the data image. Lower panels: Ellipticity and position angle as functions of the semi-major axis length from the second iteration of the fitting procedure. Blue points represent all fitted ellipses from this run, and red stars correspond to those displayed in the upper left panel. The vertical black line indicates the radius equivalent to the PSF’s FWHM after smoothing, and the shaded gray area marks the region used to determine the overall geometry (by taking the median within this range). |
| In the text | |
|
Fig. 6. Aperture photometry on the masked image in the r-band. The red ellipse corresponds to the 12″ (along the semi-major axis) aperture in which the magnitude was measured, while dashed white ellipses denote the annulus within which the background level was estimated at semi-major axes of 18″–24″. |
| In the text | |
|
Fig. 7. MHI vs. M* relation. The full black line denotes the 1:1 relation (gas richness of 1), and the dashed line denotes the 1:18 relation (gas richness of 18). |
| In the text | |
|
Fig. 8. Position of J0139+4328 on the BTFR. The dash-dotted black line is the best-fit model to the SPARC sample from Lelli et al. (2016). |
| In the text | |
|
Fig. A.1. Channel maps of the VLA detection in the rest frame of the source. Blue contours represent the data, with dark blue lines denoting positive emission and light dashed blue lines the negative. Contours are plotted starting from 3 times the noise in the cube (0.65 mJy beam−1), and are spaced by a factor of 2 in intensity. The black X indicates the H I centroid of the galaxy. |
| In the text | |
Current usage metrics show cumulative count of Article Views (full-text article views including HTML views, PDF and ePub downloads, according to the available data) and Abstracts Views on Vision4Press platform.
Data correspond to usage on the plateform after 2015. The current usage metrics is available 48-96 hours after online publication and is updated daily on week days.
Initial download of the metrics may take a while.