Open Access
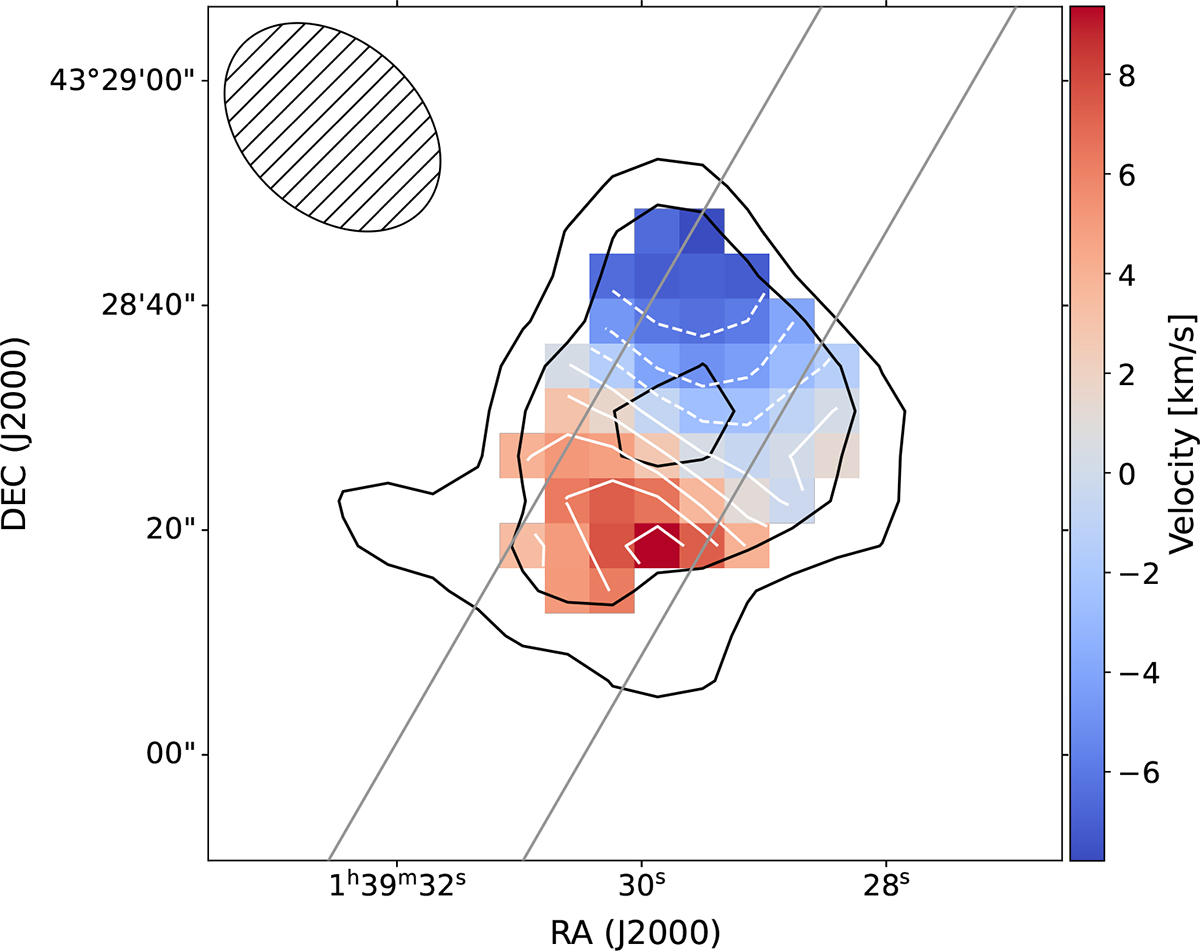
Fig. 3.
Download original image
Moment one map with total intensity H I contours at [3, 5, 10]-σ overlaid in black. White contours are iso-velocity contours separated by 2 km s−1. Full gray lines denote the area from which the position-velocity slice in Fig. 4 was extracted.
Current usage metrics show cumulative count of Article Views (full-text article views including HTML views, PDF and ePub downloads, according to the available data) and Abstracts Views on Vision4Press platform.
Data correspond to usage on the plateform after 2015. The current usage metrics is available 48-96 hours after online publication and is updated daily on week days.
Initial download of the metrics may take a while.