Open Access
Fig. 4.
Download original image
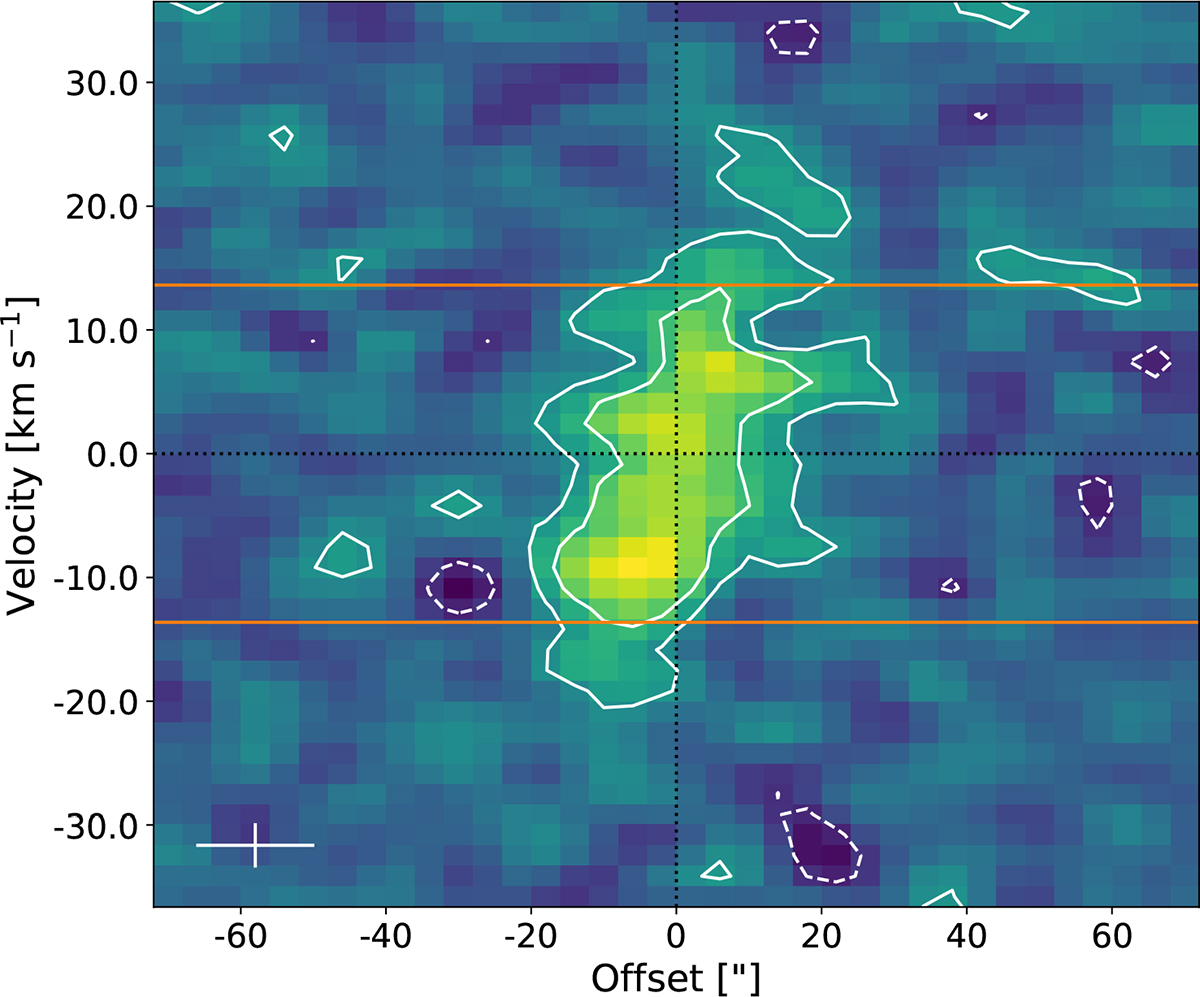
Position-velocity slice at the PA = 150°. Data contours are shown in white at [2, 4]-σ with full (dashed) lines denoting positive (negative) emission. Horizontal orange lines denote the W50 spread. In the lower left corner, we denote the beam size (horizontal line) and velocity resolution (vertical line).
Current usage metrics show cumulative count of Article Views (full-text article views including HTML views, PDF and ePub downloads, according to the available data) and Abstracts Views on Vision4Press platform.
Data correspond to usage on the plateform after 2015. The current usage metrics is available 48-96 hours after online publication and is updated daily on week days.
Initial download of the metrics may take a while.