Fig. 5.
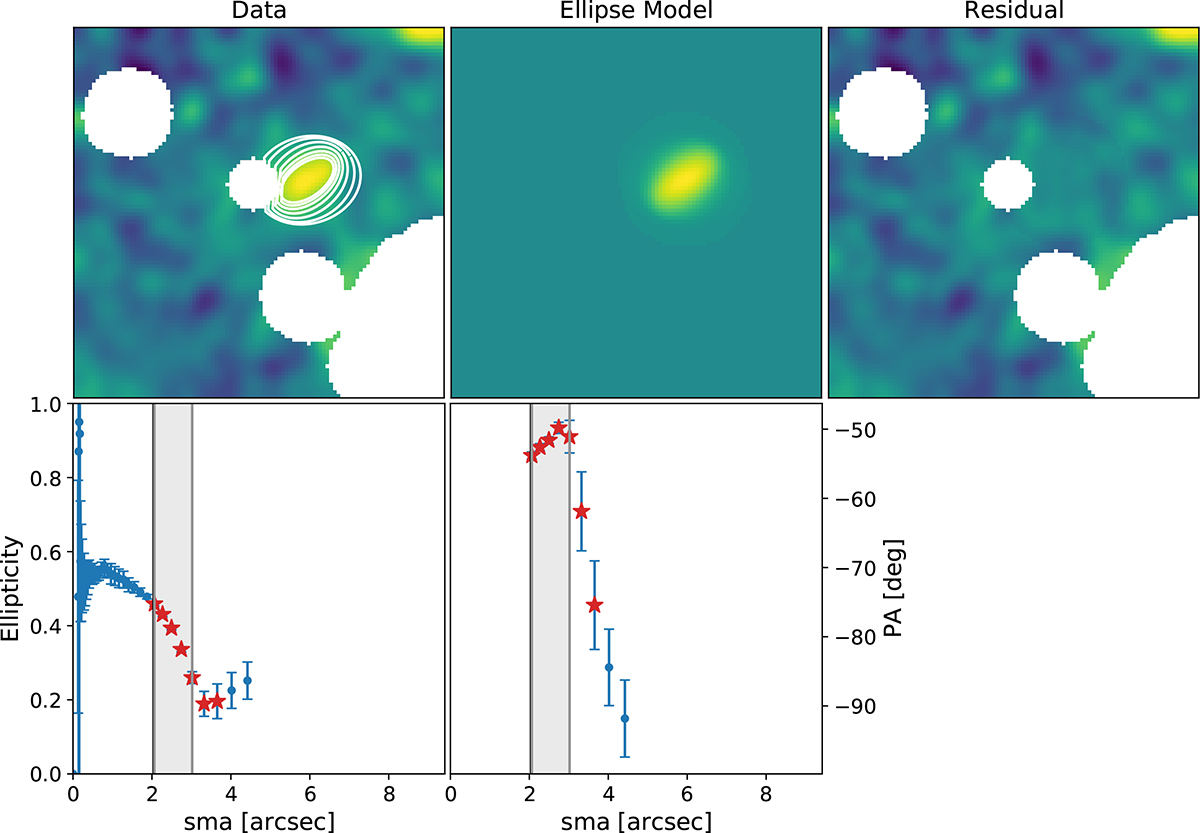
Download original image
Isophotal fitting. Upper panels: The left panel displays the smoothed image with overlaid ellipses whose corresponding parameters are indicated by red stars in the lower panels. Masked regions appear in white. The central panel presents the model reconstructed from all fitted ellipses whose parameters are shown as blue circles in the bottom panels, while the right panel shows the residual obtained by subtracting the model from the data image. Lower panels: Ellipticity and position angle as functions of the semi-major axis length from the second iteration of the fitting procedure. Blue points represent all fitted ellipses from this run, and red stars correspond to those displayed in the upper left panel. The vertical black line indicates the radius equivalent to the PSF’s FWHM after smoothing, and the shaded gray area marks the region used to determine the overall geometry (by taking the median within this range).
Current usage metrics show cumulative count of Article Views (full-text article views including HTML views, PDF and ePub downloads, according to the available data) and Abstracts Views on Vision4Press platform.
Data correspond to usage on the plateform after 2015. The current usage metrics is available 48-96 hours after online publication and is updated daily on week days.
Initial download of the metrics may take a while.