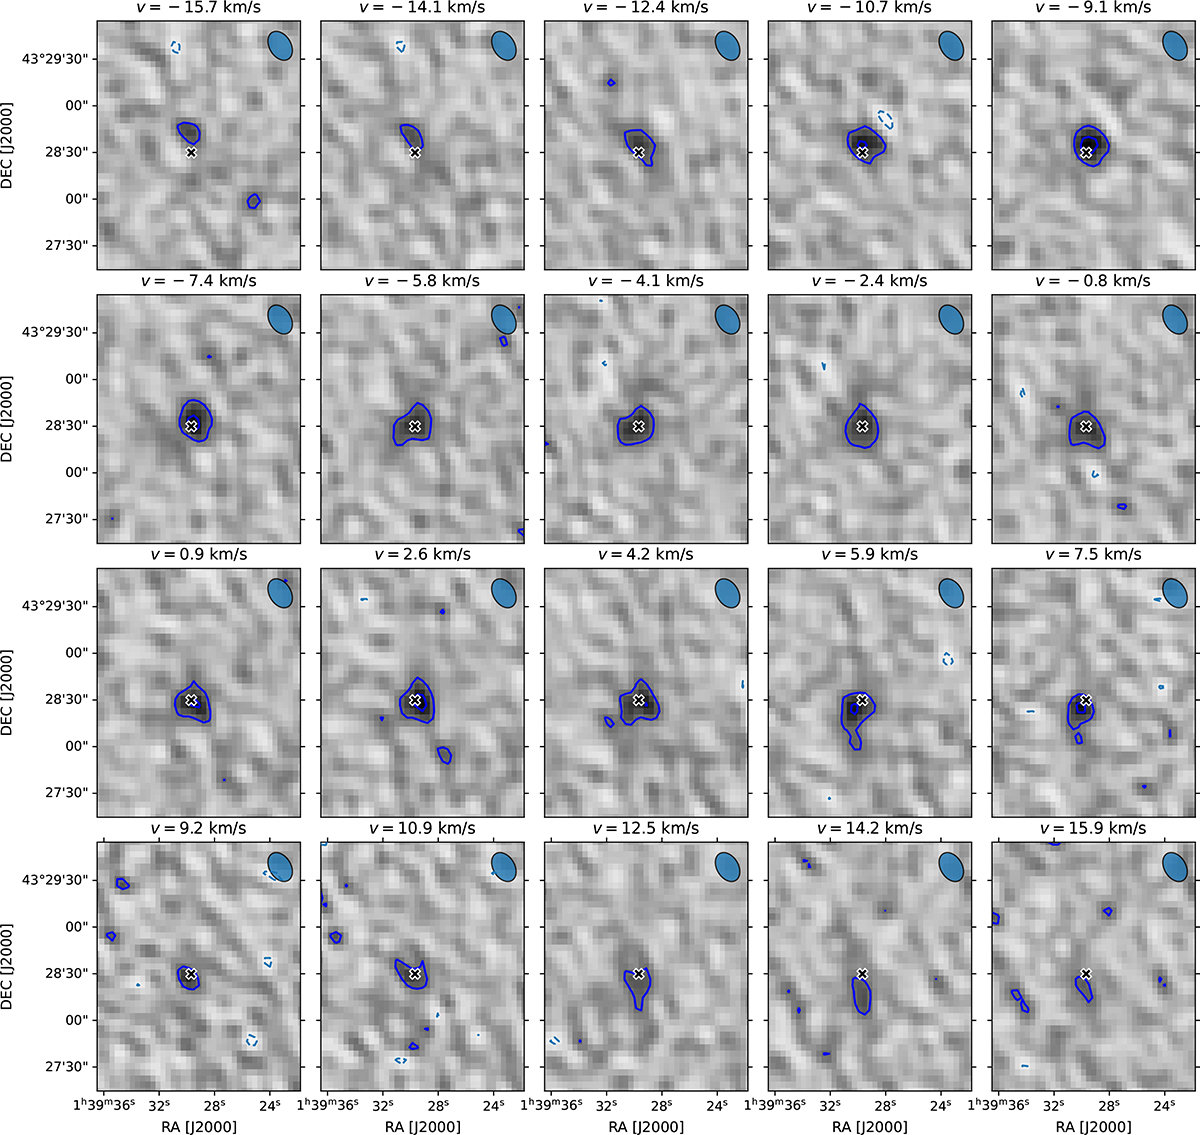
Fig. A.1.
Download original image
Channel maps of the VLA detection in the rest frame of the source. Blue contours represent the data, with dark blue lines denoting positive emission and light dashed blue lines the negative. Contours are plotted starting from 3 times the noise in the cube (0.65 mJy beam−1), and are spaced by a factor of 2 in intensity. The black X indicates the H I centroid of the galaxy.
Current usage metrics show cumulative count of Article Views (full-text article views including HTML views, PDF and ePub downloads, according to the available data) and Abstracts Views on Vision4Press platform.
Data correspond to usage on the plateform after 2015. The current usage metrics is available 48-96 hours after online publication and is updated daily on week days.
Initial download of the metrics may take a while.