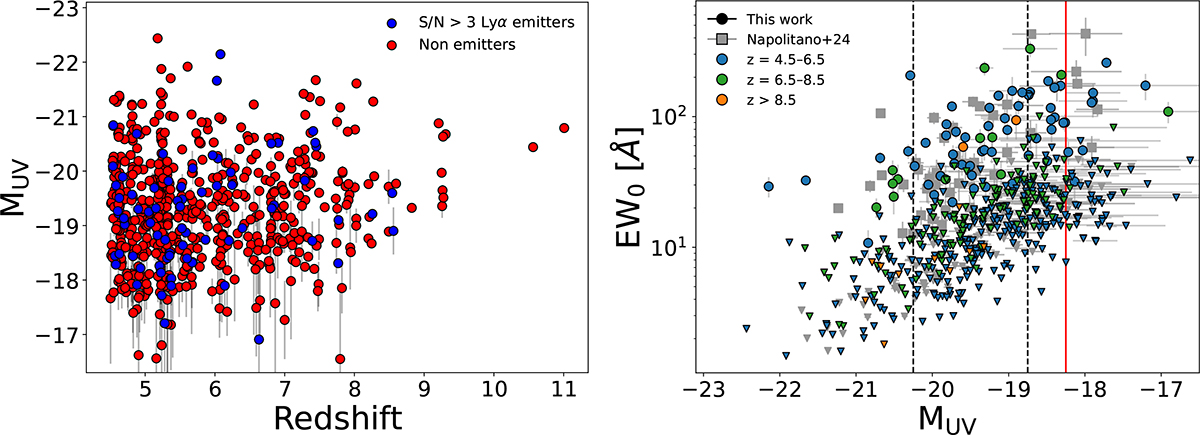
Fig. 1.
Download original image
Left: Absolute UV magnitude as a function of redshift in the UDS sample. The 73 galaxies with robust S/N > 3 Lyα detection are shown in blue, while the rest of the population is shown in red. Right: Distribution of Lyα EW0 as a function of MUV. Galaxies in the UDS with S/N > 3 are shown as circles, while upper limits EW0, lim are shown as triangles. They are color-coded by spectroscopic redshift. For comparison, we report CEERS-EGS emitters (gray squares) and upper limits (gray triangles) from Napolitano et al. (2024). The dashed black lines at MUV = –20.25 and –18.75 define the bright and faint regimes. The UDS sample is complete down to MUV = –18.25, indicated by the solid red line.
Current usage metrics show cumulative count of Article Views (full-text article views including HTML views, PDF and ePub downloads, according to the available data) and Abstracts Views on Vision4Press platform.
Data correspond to usage on the plateform after 2015. The current usage metrics is available 48-96 hours after online publication and is updated daily on week days.
Initial download of the metrics may take a while.