| Issue |
A&A
Volume 708, April 2026
|
|
|---|---|---|
| Article Number | A102 | |
| Number of page(s) | 18 | |
| Section | Extragalactic astronomy | |
| DOI | https://doi.org/10.1051/0004-6361/202556912 | |
| Published online | 01 April 2026 | |
Lyα visibility from z = 4.5 to 11 in the UDS field: Evidence for a high neutral hydrogen fraction and small ionized bubbles at z ∼ 7
1
INAF – Osservatorio Astronomico di Roma, via Frascati 33, 00078 Monteporzio Catone, Italy
2
Dipartimento di Fisica, Università di Roma Sapienza, Città Universitaria di Roma – Sapienza, Piazzale Aldo Moro, 2, 00185 Roma, Italy
3
NSF’s National Optical-Infrared Astronomy Research Laboratory, 950 N. Cherry Ave., Tucson, AZ 85719, USA
4
Astrophysics Science Division, NASA Goddard Space Flight Center, 8800 Greenbelt Rd, Greenbelt, MD 20771, USA
5
Department of Astronomy, The University of Texas at Austin, Austin, TX, USA
6
Institute for Astronomy, University of Edinburgh, Royal Observatory, Edinburgh EH9 3HJ, UK
7
University of Massachusetts Amherst, 710 North Pleasant Street, Amherst, MA 01003-9305, USA
8
Institute of Physics, Laboratory of Galaxy Evolution, Ecole Polytechnique Federale de Lausanne (EPFL), Observatoire de Sauverny, 1290 Versoix, Switzerland
9
Space Telescope Science Institute, 3700 San Martin Drive, Baltimore, MD 21218, USA
10
Institute of Science and Technology Austria (ISTA), Am Campus 1, A-3400 Klosterneuburg, Austria
11
Centro de Astrobiología (CAB), CSIC-INTA, Ctra. de Ajalvir km 4 Torrejón de Ardoz, E-28850, Madrid, Spain
12
University of Ljubljana FMF, Jadranska 19, 1000 Ljubljana, Slovenia
13
IFPU – Institute for Fundamental Physics of the Universe, via Beirut 2, I-34151 Trieste, Italy
14
MMT/Steward Observatory, University of Arizona, 933 N. Cherry St., Tucson, AZ 85721, USA
15
Max Planck Institut für Astrophysik, Karl Schwarzschild Straße 1, D-85741 Garching, Germany
16
School of Astronomy and Space Science, University of Chinese Academy of Sciences (UCAS), Beijing 100049, China
17
National Astronomical Observatories, Chinese Academy of Sciences, Beijing 100101, China
18
Institute for Frontiers in Astronomy and Astrophysics, Beijing Normal University, Beijing 102206, China
★ Corresponding author: This email address is being protected from spambots. You need JavaScript enabled to view it.
Received:
19
August
2025
Accepted:
21
February
2026
Abstract
The resonant scattering nature of Lyα photons interacting with neutral hydrogen makes Lyα emitters (LAEs) robust tracers of the intergalactic neutral hydrogen fraction, and thus sensitive probes of cosmic reionization. We present an extensive study of the Lyα evolution from galaxies at 4.5 ≤ z ≤ 11 in the UDS field, observed as part of the CAPERS survey, and complemented with spectra from the DAWN JWST Archive. The combined sample includes 651 spectroscopically confirmed Lyα-break galaxies, among which we find 73 S/N > 3 LAEs in JWST-NIRSpec PRISM spectra. We trace the redshift evolution of the LAE fraction with EW0 > 25 Å (XLyα) between z = 5 and z = 9, extending such an analysis to the UDS field for the first time. At z = 5 and 6, the UDS results agree with the average JWST XLyα values from multiple fields. However, JWST measurements are consistently lower than ground-based results. To investigate this, we compare JWST observations to a population of star-forming galaxies at z ∼ 6 observed with VLT-FORS2. We find that a Lyα slit-loss of 35 ± 10% in JWST spectra accounts for the offset, as the resonant Lyα emission is more spatially extended than the stellar continuum. From z = 6 to 7, the UDS field shows a significant drop in Lyα visibility, from which we infer a neutral hydrogen fraction of XHI = 0.7–0.9. Finally, we identify two robust ionized bubbles at z = 7.29 and 7.77, with radii of Rion = 0.6 and 0.5 physical Mpc and photometric overdensities of N/⟨N⟩ = 3 and 4, based on candidate counts down to the photometric completeness limit. Compared to the large ionized region at z ∼ 7 in the EGS field, these results indicate significant field-to-field variation, supporting a patchy, inhomogeneous reionization process.
Key words: galaxies: high-redshift / intergalactic medium / dark ages / reionization / first stars
© The Authors 2026
 Open Access article, published by EDP Sciences, under the terms of the Creative Commons Attribution License (https://creativecommons.org/licenses/by/4.0), which permits unrestricted use, distribution, and reproduction in any medium, provided the original work is properly cited.
This article is published in open access under the Subscribe to Open model. This email address is being protected from spambots. You need JavaScript enabled to view it. to support open access publication.
1. Introduction
The main goals of observational studies of the epoch of reionization (EoR) are twofold. First, they aim to identify the earliest sources responsible for reionizing their surroundings and to constrain their ionizing nature, intrinsic luminosity, and spatial clustering. A second goal is to trace the time evolution of the volume-averaged neutral hydrogen fraction (XHI) in the intergalactic medium (IGM) across multiple independent lines of sight. One of the most effective probes of the evolving IGM is the Lyman-α (Lyα, λrest = 1215.67 Å) hydrogen emission line from star-forming galaxies (Miralda-Escudé 1998; Malhotra & Rhoads 2006; Dijkstra et al. 2014). In the post-reionization Universe, the fraction of Lyα-break galaxies showing Lyα in emission (XLyα) is observed to increase with redshift, reflecting both younger stellar populations and lower dust content that let more Lyα escape from the interstellar medium (ISM, e.g., Kornei et al. 2010; Dijkstra 2017; Napolitano et al. 2023). However, due to the resonant nature of Lyα, even modest amounts of neutral hydrogen in the IGM can significantly attenuate the line, making Lyα emitters (LAEs) sensitive probes of reionization (Dijkstra et al. 2014; Ouchi et al. 2020). Ground-based spectroscopic surveys conducted on Lyα-break selected sources found a significant drop in the fraction of LAEs at z > 6–7 (Fontana et al. 2010; Stark et al. 2010; Pentericci et al. 2011; Ono et al. 2012; Pentericci et al. 2014; Schenker et al. 2014; Tilvi et al. 2014; De Barros et al. 2017; Mason et al. 2018; Pentericci et al. 2018b; Bolan et al. 2022), indicating a partially neutral IGM. Despite the progressive decline in the visibility of Lyα, several LAEs have been spectroscopically identified at z > 7, suggesting the presence of ionized bubbles in overdensities, regions where Lyα photons can escape IGM absorption due to cosmological redshifting within locally ionized zones (e.g., Finkelstein et al. 2013; Castellano et al. 2016; Hu et al. 2017; Jung et al. 2020; Tilvi et al. 2020; Endsley & Stark 2022; Jung et al. 2022; Larson et al. 2022; Leonova et al. 2022. These bubbles, typically spanning Rion ∼ 0.1 − 3 physical Mpc (pMpc, e.g., Mason & Gronke 2020), are believed to originate from local overdensities of bright galaxies and are considered the seeds of spatially inhomogeneous reionization (e.g., Keating et al. 2020; Bosman et al. 2022; Becker et al. 2024).
Ground-based efforts to detect Lyα at high redshift were restricted to following-up on the brightest sources (e.g., Ono et al. 2012; Oesch et al. 2015; Roberts-Borsani et al. 2016) and, in case of a non-detection, atmospheric telluric lines and limited spectral coverage hindered the actual redshift determination of photometrically selected candidates. The advent of the James Webb Space Telescope (JWST, Gardner et al. 2006, 2023) has fundamentally changed this picture. Its Near InfraRed Spectrograph (NIRSpec, Jakobsen et al. 2022) provides continuous wavelength coverage in the 0.6–5.3 μm wavelength range, enabling simultaneous detection of both rest-frame UV and optical features, removing the observational bias associated with the detection of Lyα. This has led to the spectroscopic confirmation of a substantial population of bright galaxies (Arrabal Haro et al. 2023b; Bunker et al. 2023; Curtis-Lake et al. 2023; D’Eugenio et al. 2024; Fujimoto et al. 2024; Wang et al. 2023; Castellano et al. 2024; Carniani et al. 2024; Hainline et al. 2024; Harikane et al. 2024; Hsiao et al. 2024; Donnan et al. 2025; Witstok et al. 2025a; Kokorev et al. 2025b; Naidu et al. 2026; Napolitano et al. 2025a; Pollock et al. 2026; Tang et al. 2025) and active galactic nuclei (AGNs, Maiolino et al. 2024; Bogdán et al. 2024; Kovács et al. 2024; Napolitano et al. 2025b; Taylor et al. 2025b) already in place within 500 million years of cosmic time.
While the extreme frontier of z > 15 photometric candidates remains unconfirmed (e.g., Castellano et al. 2025; Kokorev et al. 2025a; Pérez-González et al. 2025; Whitler et al. 2025), we now have large samples of spectroscopically confirmed galaxies at z > 4, where the Lyα-break falls within the wavelength range of JWST-NIRSpec. These observations enable us to trace the progression of cosmic reionization from its end phase (z ∼ 5.2–5.7, Becker et al. 2015; Bosman et al. 2022; Spina et al. 2024) to its midpoint (z ∼ 7.7, Planck Collaboration VI 2020) and toward the dawn of galaxy formation. Furthermore, these datasets allow for direct comparisons with the post-reionization galaxy population at z = 4–5 using the same instrumentation and methodology.
JWST has already enabled the systematic characterization of LAEs during the EoR over a wide luminosity range, from MUV < –20 down to MUV ∼ −17 (Tang et al. 2023; Chen et al. 2024; Jones et al. 2024; Jung et al. 2024; Nakane et al. 2024; Napolitano et al. 2024; Saxena et al. 2024; Tang et al. 2024b; Chen et al. 2025; Jones et al. 2025; Kageura et al. 2025; Morishita et al. 2026; Witstok et al. 2025a,b). The availability of data from multiple fields has improved constraints on cosmic variance and revealed significant field-to-field variations, reinforcing the picture of a patchy, inhomogeneous reionization (e.g., Napolitano et al. 2024; Tang et al. 2024b; Runnholm et al. 2025).
In this paper, we analyze for the first time all publicly available JWST spectra of z > 4.5 Lyα-break detected galaxies in the Ultra-deep Survey (UDS) field (Lawrence et al. 2007) to constrain the effect of the reionization process on Lyα visibility, the neutral hydrogen fraction, and the spatial distribution of ionized regions. We compare UDS results with those obtained in other JWST fields and ground-based surveys.
The paper is organized as follows. We discuss the parent sample construction in Sect. 2 and the methodology used in Sect. 3. We present the analysis of the observed redshift evolution of Lyα fraction XLyα in Sect. 4.1. The mismatch between the JWST-based and ground-based Lyα visibilities and potential JWST Lyα slit losses are discussed in Sect. 4.2. We present constraints on the UDS neutral hydrogen fraction XHI and ionized bubbles in Sects. 4.3 and 4.4, respectively. We summarize our conclusions in Sect. 5.
In the following, we adopt the ΛCDM concordance cosmological model (H0 = 70 km s−1 Mpc−1, ΩM = 0.3, and ΩΛ = 0.7). We report all magnitudes in the AB system (Oke & Gunn 1983) and equivalent widths (EWs) to rest-frame values.
2. Data
To investigate Lyα visibility during the Epoch of Reionization, we compiled the largest possible sample of galaxies with JWST spectroscopic observations in the UDS field. We focused on sources with secure redshifts (z > 4.5, see Sect. 3.1) for which Lyα falls within the blue-sensitive range of the NIRSpec-PRISM configuration. Additionally, since we analyzed spectroscopic overdensities near LAEs, we included galaxies observed with higher-resolution NIRSpec configurations, using their spectra only to obtain reliable redshift confirmations. In total we considered 651 unique galaxies at 4.5 ≤ z ≤ 11: 135 are from the CAPERS survey and 516 from other programs whose data are included in the public DAWN JWST Archive1 (DJA, Heintz et al. 2024; de Graaff et al. 2025). Among the total sample, 531 spectra were obtained from the NIRSpec-PRISM (R ∼ 30–300) configuration, and 120 with medium-resolution configurations (R ∼ 1000), including G140M/F100LP, G235M/F170LP, and G395M/F290LP.
2.1. UDS-CAPERS data
We utilized publicly released JWST-NIRSpec-PRISM data from the CANDELS-Area Prism Epoch of Reionization Survey (GO-6368, CAPERS; PI Mark Dickinson), an ongoing Cycle 3 Treasury Program. CAPERS is designed to observe a total of 21 pointings, uniformly distributed across the Cosmic Evolution Survey (COSMOS), the Ultra-deep Survey (UDS), and the Extended Groth Strip (EGS) fields, using the PRISM/CLEAR configuration. In this work, we focus on the four pointings already observed in the UDS field. These UDS observations were conducted between UT 2024 December 31 and 2025 January 10, and originally included three MSA configurations for each of the seven scheduled pointings, for a total of 21 planned configurations. Due to technical issues and communication restrictions with JWST, only eight of the planned MSA observations were completed. The remaining UDS observations are scheduled for completion by January 2026. A detailed description of CAPERS target selection and observational strategy will be presented in a forthcoming survey paper. Here, we summarize the key aspects relevant to our analysis.
Targets were selected based on their detection in the NIRCam F277W, F356W, and F444W bands. By design, the CAPERS UDS pointings have non-overlapping footprints on the sky. Exposure times vary with target priority: within a given pointing, sources were assigned to one, two, or all three MSA configurations, each providing 5690 s of integration over the same sky footprint. Among the 135 z > 4.5 CAPERS galaxies, 24, 56, and 55 have total exposure times of 17 070 s, 11 380 s, and 5690 s, respectively.
We processed the data using the STScI Calibration Pipeline2 version 1.16.1 (Bushouse et al. 2025) with CRDS version 1312.pmap, following the general procedures outlined in Arrabal Haro et al. (2023a), with two key modifications: we employed the clean_flicker_noise module3 in the calwebb_detector1 stage to mitigate the effect of 1/f noise; and we applied a modified flat-field during calwebb_spec2 stage. For slits with multiple sources (primary and known or serendipitous secondary), we combined the 2D spectra using an asymmetric nodding pattern in the calwebb_spec2 stage as described in Napolitano et al. (2025a) to mitigate contamination. We extracted the 1D spectra using optimal extraction described in Horne (1986).
To check for potential residual issues in the absolute flux calibration caused by slit losses or other inaccuracies in flux calibration files, we compared the extracted spectra with broadband photometry from Merlin et al. (2024) by integrating the spectra across the NIRCam filter bandpasses of F090W, F115W, F150W, F200W, F277W, F356W, and F444W. We only considered the resulting synthetic photometry with a signal-to-noise ratio (S/N) of > 5. For each spectrum, we computed a correction factor per filter by comparing synthetic and observed fluxes, then applied a weighted average correction. This correction was independent of wavelength and was applied uniformly to fluxes and associated uncertainties. We note that the photometric correction does not affect EW and UV β slope measurements.
2.2. Other UDS data from DJA archive
To complement the CAPERS data, we collected all publicly available JWST spectroscopic observations in the UDS field from version 3 of DJA. We limited our selection to the most robust identifications (flagged as grade = 3 in DJA) at z > 4.5, to match the redshift range of interest.
This selection includes: 459 spectra from GO-4233 (RUBIES; PI deGraaff, de Graaff et al. 2025), of which 361 and 98 are in the NIRSpec-PRISM and NIRSpec-G395M/F290LP configurations, respectively; 31 PRISM spectra from GTO-1215 (PI Luetzgendorf); 4 PRISM spectra from GO-2565 (PI Glazebrook and Nanayakkara, Kawinwanichakij et al. 2026); and 22 medium resolution (G140M/F100LP, G235M/F170LP, and G395M/F290LP) spectra from GO-3543 (EXCELS; PI Carnall, Carnall et al. 2024). For consistency, we applied the same photometric correction method to all PRISM spectra as described for CAPERS. We note that the combination of RUBIES and CAPERS data accounts for 91% of the final sample. We verified that both RUBIES and CAPERS rely on detections in the same set of NIRCam bands (F277W, F356W, and F444W), ensuring broadly consistent target selection across the two datasets.
3. Methods
3.1. Spectroscopic redshift
Spectroscopic redshifts in the CAPERS dataset were determined using a combination of automated tools, interactive inspection, and visual vetting. Each redshift was assigned a quality flag to indicate its reliability, with flags 3 and 4 designating the most secure solutions, supported by multiple emission line detections. Full details of the procedure will be provided in a forthcoming CAPERS survey paper. For galaxies retrieved from the DJA archive, we used the secure spectroscopic redshifts (flagged as grade = 3) provided by msaexp (Brammer 2022) as a reference. Based on secure CAPERS and DJA redshift solutions, we preselected sources with z > 4.5. We then visually inspected the 1D and 2D spectra of all selected objects to validate the spectroscopic redshift solution based on rest-frame optical, UV emission lines, and the Lyα-break. When emission lines with S/N > 3 are detected, we computed redshifts using their observed centroids (e.g., Castellano et al. 2024; Napolitano et al. 2025a). The expected observed emission line profile was broadened by the instrumental resolution, with a standard deviation given by ![Mathematical equation: $ \sigma_R (\lambda_{\mathrm{obs}}) [\AA] = \lambda_{\mathrm{obs}} / 2.355 R(\lambda_{\mathrm{obs}}) $](/articles/aa/full_html/2026/04/aa56912-25/aa56912-25-eq1.gif) . The resolution was provided by the JWST documentation4 with the assumption of a source that illuminates the slit uniformly. The final spectroscopic redshift was computed as a weighted average of all significant line-based estimates. For reference, we used the following key rest-frame optical lines when available: Hα, [OIII]λ5007, [OIII]λ4959, Hβ, and [OII]λλ3727,29 in 510, 572, 271, 533, and 199 cases, respectively. Spectroscopic redshifts are reported in the left panel of Fig. 1 and Table A.1. All sources observed with NIRSpec-PRISM show a robust detection of the Lyα-break. The spectroscopic redshifts we find always agree with the CAPERS and DJA redshift solutions used as preselection.
. The resolution was provided by the JWST documentation4 with the assumption of a source that illuminates the slit uniformly. The final spectroscopic redshift was computed as a weighted average of all significant line-based estimates. For reference, we used the following key rest-frame optical lines when available: Hα, [OIII]λ5007, [OIII]λ4959, Hβ, and [OII]λλ3727,29 in 510, 572, 271, 533, and 199 cases, respectively. Spectroscopic redshifts are reported in the left panel of Fig. 1 and Table A.1. All sources observed with NIRSpec-PRISM show a robust detection of the Lyα-break. The spectroscopic redshifts we find always agree with the CAPERS and DJA redshift solutions used as preselection.
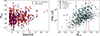 |
Fig. 1. Left: Absolute UV magnitude as a function of redshift in the UDS sample. The 73 galaxies with robust S/N > 3 Lyα detection are shown in blue, while the rest of the population is shown in red. Right: Distribution of Lyα EW0 as a function of MUV. Galaxies in the UDS with S/N > 3 are shown as circles, while upper limits EW0, lim are shown as triangles. They are color-coded by spectroscopic redshift. For comparison, we report CEERS-EGS emitters (gray squares) and upper limits (gray triangles) from Napolitano et al. (2024). The dashed black lines at MUV = –20.25 and –18.75 define the bright and faint regimes. The UDS sample is complete down to MUV = –18.25, indicated by the solid red line. |
3.2. AGN identification
To identify AGNs within the sample for further selection (see Sect. 4), we first visually inspected all spectra for the presence of broad Balmer emission lines. We used Hα as the reference line, while at z > 7 where Hα falls outside the spectral coverage, we instead considered Hβ. We then performed a quantitative fit to the emission profile, testing two models on top of a linear continuum: a single narrow Gaussian with the standard deviation fixed by the instrumental resolution σR(λobs), corresponding to a full width at half maximum (FWHM) of ∼1000–2000 km/s; and a combination of a narrow and a broad Gaussian component. Uniform priors were adopted for the amplitudes, and the broad component was allowed to have a FWHM up to 10 000 km/s. The model parameters were sampled using the EMCEE Markov chain Monte Carlo (MCMC) sampler (Foreman-Mackey et al. 2013), with 30 walkers and 10 000 steps. The best-fit parameters and uncertainties were derived from the posterior median and the 68-th percentile intervals, respectively. Following Juodžbalis et al. (2026), to evaluate the necessity of the broad component, we used the Bayesian information criterion (BIC), which incorporates both the goodness of fit (χ2) and the number of free parameters. To accept the model with the broad emission line, we required a ΔBIC > 0. Additionally, we required the best-fit broad FWHM to exceed the instrumental resolution by more than 2σ to ensure robustness. This two-step criterion minimizes false positives and guarantees that the broad feature is both statistically and physically significant. With this approach, we identified 24 sources as broad-line AGNs (BLAGNs), 20 of which are from the UDS-RUBIES sample. Among the RUBIES sources, eight were previously classified as BLAGN by Taylor et al. (2025a) and nineteen by Hviding et al. (2025).
Additionally, we cross-matched the UDS dataset with the X-ray-detected sources from X-UDS (Kocevski et al. 2018), which provides ∼600 ks of Chandra coverage across the field. However, we note that the current X-ray data do not allow us to identify heavily obscured or X-ray weak AGNs (Madau & Haardt 2024), which may still be present in the UDS sample. In particular, narrow-line AGNs (NLAGNs) may represent up to ∼20% of spectroscopic galaxy samples, as shown in the JADES and CEERS surveys by Scholtz et al. (2025) and Mazzolari et al. (2025), respectively. However, identifying NLAGNs requires multiple robust line detections in both the UV and optical rest-frame. These emission lines are necessary to constrain key physical properties (e.g., metallicity, ionization parameter, abundance ratios) and place sources in diagnostic diagrams designed to distinguish AGNs from star-forming galaxies (e.g., Hirschmann et al. 2019, 2023; Mazzolari et al. 2024), and to fairly compare with photoionization models (e.g., Feltre et al. 2016; Gutkin et al. 2016; Nakajima & Maiolino 2022). At high redshift, even for sources with extreme line emission and high S/N, such as GHZ2 (Castellano et al. 2024), current low-resolution PRISM data have yielded inconclusive classifications. In the UDS sample, most galaxies are missing the key line transitions needed for robust NLAGN diagnostics. Given these limitations, we do not attempt NLAGN identification in this work.
In the following, we consider as AGNs only the 24 sources identified through the broad-line selection. The list of confirmed AGNs is provided in Table A.1.
3.3. MUV and β
Following Napolitano et al. (2025a), we estimated the UV slope β for all the NIRSpec-PRISM sources by fitting a power-law model (fλ ∝ λβ) to the continuum flux in the rest-frame range 1350–2600 Å. This wavelength range avoids the damping wing region (1200–1350 Å), which can bias the UV slope, especially at high redshift (e.g., Dottorini et al. 2025). To avoid contamination, we masked known bright features (i.e., CIVλλ1548,51 and CIII]λ1909) using line widths broadened according to the instrumental resolution (see Sect. 3.1). The fitting was performed using the EMCEE with 30 walkers and 500 000 steps. We adopted a flat prior on β between –3.5 and 0. The best-fit value and uncertainty were derived from the posterior median and standard deviation, respectively. Each fit is visually inspected to ensure reliability.
If the fit was successful (86% of cases), we computed the absolute UV magnitude (MUV) from the model flux averaged over 1450–1550 Å in the rest-frame. In the remaining cases (14% of total) in which the posterior distribution implies a S/N < 3, we derived MUV directly from the median observed flux in the same wavelength range, and the UV β slope from the relation derived by Dottorini et al. (2025):

For galaxies observed in medium-resolution configurations, where the continuum is typically undetected, we estimated MUV from the photometry, considering only the relevant bands whose throughput5 includes the 1500 Å rest-frame information. We note the considered UDS sample is complete down to MUV = –18.25. All results are reported in the left panel of Fig. 1 and Table A.1. While the UV slope is unaffected by the photometric correction, we report MUV using the flux-corrected spectra.
3.4. Lyα emission line measurements
We briefly summarize the Lyα fitting procedure previously adopted in Napolitano et al. (2024). Due to the low spectral resolution of the NIRSpec-PRISM, Lyα emission was modeled within a ∼4–5 pixel window centered on the observed peak. As a first step, we computed the line flux via direct integration over this window. The continuum was estimated by a linear fit to the red side of Lyα, from 1900 Å to 3 pixels redward of the emission peak. Chen et al. (2024) and Napolitano et al. (2024) showed that this method underestimates the intrinsic Lyα flux by 30–50%.
To refine the measurement, we adopted a forward-modeling approach. We constructed a library of Gaussian emission with FWHMs uniformly sampled in the 100–1500 km/s range. For each profile, the amplitude was drawn from a uniform distribution constrained to yield an integrated flux within a factor of 0.2–5 of the value obtained via direct integration. Each Gaussian profile was combined with a step-function continuum: the red side is given by the linear fit, while the blue side is fixed to the median flux blueward of the line, accounting for IGM absorption. The full model was convolved with a Gaussian kernel (σR(λobs)) matching the instrumental resolution. We performed the fit using EMCEE with 10 walkers and 20 000 steps. The best-fit Lyα flux and EW0 were derived from the posterior median, and uncertainties from the 68-th percentile intervals.
In total, we identify 73 robust Lyα emitters with S/N > 3. They are reported in the left panel of Fig. 1. In the appendix (see Appendix A) we show the fit Lyα line profiles for all sources together with the associated continuum fits, and their residuals (Fig. A.1), which show no evidence of systematic deviations. For all galaxies, including non-emitters, we derived the limiting rest-frame equivalent width that could be measured (EW0, lim) following Equation (2) from Jones et al. (2024), which incorporates the flux uncertainty at the Lyα peak (E(λLyα)), the continuum level ( ), and the Gaussian kernel that accounts for the instrumental resolution:
We used these limits to assess the Lyα sample completeness, as described in Sect 4.1. We show the measured rest-frame equivalent width and limits as a function of MUV in the right panel of Fig. 1. Results are reported in Table A.1. We note that Chen et al. (2025) discuss the Lyα emission of RUBIES-24303, RUBIES-930869, and CAPERS-142615, finding Lyα EW0 compatible with our measurements, within 1–2σ uncertainty.
3.5. SED fitting
Stellar masses were derived from a spectral energy distribution (SED) fit of the observed photometry (Merlin et al. 2024), fixing the redshift of each source to the spectroscopic value. We fit synthetic stellar templates with the SED fitting code ZPHOT (Fontana et al. 2000), following the method described in Santini et al. (2023). We adopted Bruzual & Charlot (2003) models, assumed a Chabrier (2003) IMF, and modeled delayed star formation histories (SFH(t) ∝ (t2/τ)⋅exp(−t/τ)), with the e-folding timescale, τ, ranging from 100 Myr to 7 Gyr. The time elapsed since the onset of star formation was constrained to be between 10 Myr and the age of the Universe at each galaxy redshift, while for the metallicity we assumed values of 0.02, 0.2, or 1 times the solar metallicity. For the dust extinction, we used the Calzetti et al. (2000) law with E(B − V) ranging from 0 to 1.1. Nebular emission was included following the prescriptions of Castellano et al. (2014) and Schaerer & de Barros (2009). Briefly, hydrogen lines were computed from the number of hydrogen-ionizing photons predicted by the stellar SED, assuming case B recombination, a null LyC escape fraction, an electron temperature of Te = 10 000 K, and an electron density of Ne = 100 cm−3. Nebular E(B-V) was assumed to be equal to the stellar reddening. He and metal lines were added by scaling the Hβ flux using the tabulated values as a function of metallicity from Anders & Fritze-v. Alvensleben (2003).
4. Lyα constraints on reionization in the UDS field
After three years of operations, JWST has yielded a statistically significant number of Lyα-break galaxy spectra at z > 4, enabling measurements of the evolving neutral hydrogen fraction across several extragalactic fields, including EGS, GOODS-S, GOODS-N, and Abell-2744 (e.g., Jones et al. 2024; Nakane et al. 2024; Napolitano et al. 2024; Umeda et al. 2024; Tang et al. 2024b; Jones et al. 2025; Kageura et al. 2025; Umeda et al. 2026). In this section, we extend such analyses to the UDS field for the first time, presenting a systematic measurement of the Lyα emitter fraction and the corresponding neutral hydrogen fraction using JWST spectroscopic observations. We compare the UDS results with both JWST-based and ground-based estimates from the relevant literature.
4.1. The evolution of the Lyα fraction
We defined the Lyα emitter fraction, XLyα, as the ratio between the number of galaxies with a detected S/N > 3 Lyα emission with EW0 > 25 Å and the total number of Lyα-break galaxies with no signs of AGN activity (Sect. 3.2), restricted to the absolute UV magnitude range –20.25 < MUV < –18.75. All galaxies within this range have a secure UV continuum detection (see Sect. 3.3). The same UV selection is commonly adopted in the literature (e.g., Stark et al. 2011; Pentericci et al. 2011; Ono et al. 2012) to ensure a consistent and fair reference sample for comparisons. This is motivated by the well-established correlation between MUV and Lyα EW0 (e.g., Nakane et al. 2024; Napolitano et al. 2024; Jones et al. 2025, see also Fig. 1), driven by intrinsic galaxy properties that regulate Lyα radiative transfer through the interstellar and circumgalactic media. To ensure completeness, we only included Lyα-break galaxies with a limiting rest-frame equivalent width EW0, lim < 25 Å. Galaxies with EW0, lim > 25 Å were excluded from the statistical analysis, regardless of whether Lyα emission is formally detected. This results in a total sample of 216 galaxies. In practice, we restricted the sample to spectra with sufficient sensitivity to confidently detect a line above the adopted EW0 threshold, given the continuum level and redshift. This prevents upward bias from bright lines detected in shallow spectra, as well as downward bias from continuum-faint sources in which Lyα with such a small EW0 would be undetectable even if present. We find that 46% of the Lyα-break galaxies in the UDS sample meet the above criteria. We remark that XLyα was calculated using the measured EW0 values, without correcting for additional Lyα slit losses.
We measured XLyα across five redshift bins centered at z = 5, 6, 7, 8, and 9, each with a width of Δz = 1. Given the small-number statistics, uncertainties were estimated following Gehrels (1986). The redshift evolution of the Lyα emitter fraction in the UDS field is presented in Table 1 and Fig. 2.
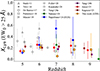 |
Fig. 2. Redshift evolution of the fraction of galaxies with observed EW0 > 25 Å. Results from this work are shown as orange circles. No correction for Lyα slit losses was applied. Error bars were computed using binomial statistics following Gehrels (1986). Colored points represent JWST estimates (Nakane et al. 2024; Napolitano et al. 2024; Tang et al. 2024b; Jones et al. 2025; Kageura et al. 2025), while open symbols with black edges correspond to ground-based literature results (Stark et al. 2011; Tilvi et al. 2014; De Barros et al. 2017; Pentericci et al. 2018b; Mason et al. 2019; Fuller et al. 2020; Kusakabe et al. 2020; Tang et al. 2024a). Data points have been slightly shifted in redshift for clarity. |
Observed fraction of Lyα-emitting galaxies with EW0 > 25 Å as a function of redshift.
We observe an increase in XLyα between z = 5 and z = 6 and then a decrease to z = 7, as has previously been observed in many other studies. At higher redshift (i.e., the z = 8 and z = 9 bins) we have an apparent increase although the results are particularly affected by small-number statistics, with only 12 and 6 Lyα-break galaxies, respectively.
We compared our results with other JWST-based estimates (Nakane et al. 2024; Napolitano et al. 2024; Tang et al. 2024b; Jones et al. 2025; Kageura et al. 2025) as well as with ground-based surveys (Stark et al. 2011; Tilvi et al. 2014; De Barros et al. 2017; Pentericci et al. 2018b; Mason et al. 2019; Fuller et al. 2020; Kusakabe et al. 2020; Tang et al. 2024a) that adopt similar selection criteria. Previous JWST measurements were based on multiple-fields data, including the EGS, Abell-2744, GOODS-S and GOODS-N, with the exception of Napolitano et al. (2024), which reported EGS results. To better assess the comparison, we computed the weighted average JWST-based Lyα emitter fraction, XLyα, using all available estimates, where the weights were defined as the inverse variances from the original papers. As the estimates from different studies rely on partially overlapping datasets, we caution that they are not statistically independent and that the weighted average should be considered as a descriptive reference of literature findings on the combined JWST fields. The results are summarized in Table 1. In particular we note that at z = 5 and z = 6, average results from multiple fields agree very well with those derived in the UDS field alone, as well as the EGS field alone. The lack of significant field-to-field variations at these redshifts confirms that the Universe is largely ionized, with little residual neutral hydrogen (e.g., Bosman et al. 2022; Spina et al. 2024), and therefore the visibility of Lyα is primarily driven by the intrinsic properties of galaxies, rather than by the IGM.
On the other hand, at z = 7, there is a significant scatter between the fractions of Lyα obtained from different fields. In the EGS field, it is anomalously high, while in the UDS it is comparatively low, with the two measurements differing at the ∼2.7σ level. The other points reported in the figure were computed on more than one field: for example, the fraction by Jones et al. (2025) is from GOODS-S and GOODS-N, while Kageura et al. (2025) also includes the EGS and Abell-2744 fields, therefore providing only median visibilities across different lines of sight. This highlights that at z = 7 (and above) the visibility of Lyα is also driven by local IGM conditions. For example, the high incidence of Lyα emitters at z ∼ 7 in the EGS field has been previously reported (e.g., Chen et al. 2024; Napolitano et al. 2024; Tang et al. 2024b) and attributed to the presence of large ionized region(s) (ionized bubbles identified in Tilvi et al. 2020; Jung et al. 2022; Leonova et al. 2022; Chen et al. 2024; Napolitano et al. 2024; Chen et al. 2025) that locally enhance Lyα transmission (e.g., Ouchi et al. 2010). In contrast, the low Lyα fraction found in the UDS field at z ∼ 7 would support a scenario with a largely neutral IGM condition. In this sense, the EGS and UDS fields would represent extreme and opposite conditions in the IGM neutral hydrogen content at z = 7.
We further derived the implications for the neutral hydrogen fraction on these two fields in Sect. 4.3. These findings highlight the importance of wide-field, multi-pointing surveys to accurately quantify the global visibility of Lyα during reionization. They also support a scenario of highly spatially inhomogeneous reionization, in which the presence of ionized bubbles can significantly alter the Lyα visibility (e.g., Taylor & Lidz 2014), as has also been suggested by LAE clustering analyses (e.g., Ouchi et al. 2010, 2018; Umeda et al. 2025).
At redshift 8 and above, the scatter between various results is also very large, but we emphasize that all fractions are based on very low number statistics.
Although all JWST-based estimates are in good agreement in the post-ionization Universe a tension persists at z = 5 and z = 6 between the new JWST results and previous ground-based measurements. We discuss this discrepancy in the next section.
4.2. Comparison between JWST and ground-based spectroscopic Lyα-break samples at z ∼ 6
At z ∼ 6 the cosmic reionization process is nearly complete, making the selected Lyα-break populations a valuable reference point for the early post reionization Universe. In the previous section, we showed that JWST observations consistently give a fraction of Lyα emitters around 21% at z = 6, with very little field-to-field variation as expected in the (almost completely) reionized Universe. However, we note that ground-based results provide a substantially larger number of Lyα emitters (De Barros et al. 2017; Schenker et al. 2012) at the same redshift and in the same MUV range, a result further supported by ground-based narrow-band selections (e.g., Arrabal Haro et al. 2018).
Any statistically significant differences in the Lyα properties between two sets of Lyα-break samples at z ∼ 6 including data from multiple fields that limits the effect of cosmic variance are likely driven by observational biases, rather than intrinsic astrophysical effects. To search for such biases, we compared Lyα emission from JWST spectra (including Jones et al. 2024; Napolitano et al. 2024, and this work, i.e., data from four fields) to the population of star-forming galaxies observed through ground-based spectroscopy in De Barros et al. (2017) (hereafter DB17) at z ∼ 6. DB17 provides a comprehensive catalog of galaxies at 5.1 < z < 6.6, including sky coordinates, redshift, MUV, UV β slope, and Lyα EW0, regardless of the presence of Lyα emission. This makes it a robust complete sample for Lyα-break selected galaxies. To enable a fair comparison between the Lyα statistics of the two datasets, but still keep significant numbers of sources, we restrict our analysis to galaxies in the ranges –21 < MUV < –18.75 and 5.5 < z < 6.5. Galaxies within these ranges are well represented in both the JWST and ground-based samples. In particular, at z ∼ 6 the JWST sample extends significantly fainter than MUV = –18.75 (see Fig. 1, left), ensuring completeness across the adopted magnitude range. Overall, the sample includes 108 JWST galaxies and 86 galaxies from DB17. We note that the DB17 sample combines data from five separate fields.
A possible cause of the diversity between the two samples could be due to the selection bands. The ground-based sample from DB17 mostly comes from the CANDELSz7 program, based on the H band selection by Pentericci et al. (2018a) in CANDELS (Grogin et al. 2011; Koekemoer et al. 2011), with additional sources also coming from other programs selected in the Y band centered at 1.05 μm. This corresponds to selecting z ∼ 6 galaxies based on their rest-frame UV emission (1500–2300 Å). In contrast, as discussed in Sect. 2, JWST targets were selected using a combination of the NIRCam F277W, F356W, and F444W bands, which trace the rest-frame optical (4000–6300 Å). As a result, a potential selection bias could be present, with the ground-based sample favoring bluer galaxies in the rest-frame UV, while the JWST sample may preferentially include galaxies with higher stellar masses due to the use of rest-frame optical selection bands. Since broad correlations between Lyα and the spectral slope and stellar masses are known to exist (e.g., Schenker et al. 2014; Napolitano et al. 2023), the different selection would then cause a different prevalence of strong Lyα emitters. For the MUV matched ground based and JWST samples, we performed a Kolmogorov-Smirnov test on the distributions of UV β slopes and stellar masses. In both cases, we find no statistically significant evidence that the JWST and ground-based samples are drawn from different parent distributions. A direct comparison of the UV β slope is shown in the left panel of Fig. 3.
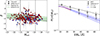 |
Fig. 3. Left: UV β slope as a function of MUV for galaxies in the redshift range 5 < z < 6.5 (circles), matching the selection in De Barros et al. (2017) (stars). The continuous black lines at MUV = –21 and –18.75 mark the range considered. Galaxies with Lyα EW0 > 25 Å are shown in blue, while the rest of the population is shown in red. The best-fit relation and 1σ uncertainty at z ∼ 6 from Topping et al. (2024) and Dottorini et al. (2025) are overplotted in black and green, respectively. Right: Cumulative distribution functions of Lyα EW0 at z ∼ 6. The DB17 and JWST Lyα-break samples are shown as stars and circles, respectively. Error bars were computed following Gehrels (1986). The dashed black line shows the best-fit exponentially declining function to the DB17 data, corresponding to a case with no Lyα slit loss (T = 1). The dashed blue line and shaded blue region represent the JWST extracted CDF assuming T = 0.65 ± 0.10. The dashed red area indicates the EW0 range where a direct comparison is not possible due to the JWST completeness limit. |
Another potential difference between the ground-based and JWST samples is that the redshift identification of the former was based on the presence of the Lyα line and the Lyα-break, with no other spectral feature. In the absence of detectable Lyα emission or break, the photometric redshift was assumed to be the correct one. We verified the accuracy of the redshifts reported in DB17 by cross-matching their catalog with available JWST spectra from the DJA archive. This step is essential, particularly for low-S/N and unconfirmed sources whose redshift is based on the photometric estimate. Among the 35 DB17 galaxies with available JWST spectra, we confirm the ground-based redshifts within the quoted uncertainties in 32 cases: 20 were associated with Lyα emitters, 4 were confirmed by DB17 as Lyα-break galaxies, and 8 had only a photometric redshift in DB17 that is now confirmed spectroscopically. In three further cases, in which DB17 used the photometric redshift, the JWST spectroscopic redshift differs significantly from the previously assumed value, revealing a foreground (z = 0.7) interloper and two background (z = 7.2, 8.4) interlopers. For the remaining DB17 galaxies, no JWST spectra are currently available. Given the small number of interlopers, we conclude that the ground-based sample was accurate in tracing the z ∼ 6 population. Note that in Pentericci et al. (2018b) the interloper fraction was assumed to be 10%, which is very close to our findings.
Finally, we note that AGN identification in ground-based samples relied solely on cross-matching with available X-ray catalogs. Prior to JWST, the peculiar high AGN fraction at high redshifts (10–20%, e.g., Scholtz et al. 2025; Mazzolari et al. 2025; Juodžbalis et al. 2026) was not known. To our knowledge, AGN contamination was only marginally considered in previous analyses. In any case, to ensure consistency in the sample selection, for the only purpose of this comparison of Lyα emission at z ∼ 6, we include confirmed JWST AGNs.
Given that we do not find any evidence of bias in the sample selection, or inaccuracies in the ground-based redshift determination, the significant differences in the Lyα properties between the JWST and DB17 samples at z ∼ 6 must therefore be driven by the observational Lyα slit loss (e.g., Melinder et al. 2023; Nakane et al. 2024; Tang et al. 2024a) that is caused by differences in the slit widths of ground-based (∼0.7–1 arcsec) and JWST (0.2 arcsec, Jakobsen et al. 2022) spectrographs, combined with the resonant nature of Lyα emission. Specifically, Lyα photons can scatter to spatial scales larger than the stellar continuum, producing emission that is offset by ∼0.1 arcsec (Ning et al. 2024; Bhagwat et al. 2025) or extended over larger regions (e.g., Leclercq et al. 2017; Kusakabe et al. 2022).
To independently estimate the JWST Lyα slit loss, we compared the cumulative distribution functions (CDFs) of Lyα EW0 between the DB17 and the combined JWST sample from Jones et al. (2024), Napolitano et al. (2024), and this work.
The DB17 CDF was assumed as a reference to the case with no significant slit loss, where the transmission factor (T) equals unity. We modeled the DB17 CDF with an exponentially declining function, fit by weighting the measured uncertainties. We derived the associated normalized probability density function (PDF), which was then used to generate 1000 Lyα EW0 draws for each galaxy in the JWST sample. To incorporate the JWST Lyα detection completeness (see Fig. 1), we accounted for the EW0 sensitivity limit of each galaxy. Based on the observed MUV, we assigned non-detections (EW0 = 0) to all randomly drawn values falling below the threshold EW . This threshold was determined via a linear fit to the upper limits observed in the JWST sample, and is typically around 10–20 Å at z ∼ 6.
The resulting EW0 distribution thus represents a simulated population consistent with JWST selection criteria, but unaffected by Lyα slit losses. We then applied varying transmission factors to this simulated EW0 sample and compared the resulting CDFs to the observed JWST distribution. We found the best match when T = 0.65 ± 0.10, implying an average Lyα slit loss of 35 ± 10% when comparing JWST-NIRSpec and ground-based VLT-FORS2 EW0 measurements (see Fig. 3). This estimate is broadly consistent with recent results at z ∼ 6. For instance, Nakane et al. (2024) report Lyα slit losses of 28 ± 8% from a forward-modeling analysis comparing JWST and VLT-FORS2, assuming different scale lengths for the UV and Lyα spatial profiles (see their Appendix B). Similarly, Tang et al. (2024a) found ∼20% Lyα slit loss when comparing JWST-NIRSpec and ground-based VLT-MUSE EW0 values. Finally, Bhagwat et al. (2025) used the SPICE radiation-hydrodynamical simulation (Bhagwat et al. 2024) to investigate the Lyα JWST–FORS2 mismatch. Selecting galaxies in the range of –21 < MUV < –18.75, with no spatial offset between the UV and Lyα emission, they found Lyα slit losses of 26–37%, depending on the stellar feedback model adopted. The best agreement with our observational result was found for their BURSTY-SN model, which assumes that all supernovae explode after 10 Myr, releasing 2 × 1051 erg in a single event. However, we note that, within the uncertainty, our observational constraint remains consistent with all their supernova feedback models.
In the following section, we apply the derived Lyα slit loss correction to the z = 7 UDS Lyα-break galaxy population observed with JWST, assuming that the correction does not evolve with redshift. This assumption is supported by the observed lack of evolution in the spatial offset between UV and Lyα emission from z = 4 to z = 7 (e.g., Hoag et al. 2019; Lemaux et al. 2021).
4.3. The evolution of the neutral hydrogen fraction at z ∼ 7
To derive the evolution of Lyα transmission in the IGM between z = 6 and z = 7, we adopted the DB17 sample at z = 6 as a complete representation of the Lyα-break population in a post-reionization Universe. At this epoch, the IGM is already highly ionized, with a volume-averaged neutral hydrogen fraction of XHI ∼ 5 × 10⁻³, and is therefore assumed to be effectively transparent to Lyα photons (see Fig. 2 in Ellis 2025). We selected the parent Lyα-break subsample in the range of –20.25 < MUV < –18.75 and compared the resulting EW0 CDF to the JWST measurements at z = 7. The UDS CDF was derived from the EW0 values corrected for the observed Lyα slit loss derived in the previous section (Sect. 4.2) after selecting the sample in the same MUV range, further requiring no AGN activity and EW0, lim < 25 Å.
The impact of a neutral IGM on Lyα visibility was derived by considering the IGM transmission models of Dijkstra et al. (2011), which combine galactic outflow effects with large-scale semi-numeric simulations of reionization. These models assume NHI = 1020 cm−2, outflow velocities of 25–200 km/s, no dust absorption, and an intrinsic exponentially declining CDF at z = 6 with an e-folding scale of 50 Å. This value is in excellent agreement with our best-fit to the DB17 CDF (50 ± 10 Å).
We applied the modeled IGM transmission as a function of the neutral hydrogen fraction to the DB17 CDF and compared the resulting curves to the observed JWST CDFs in the UDS and EGS fields (Fig. 4). The UDS sample is consistent with a significantly neutral IGM, with XHI ∼ 0.7–0.9. We note that the Lyα slit loss correction shifts the completeness limit of the CDF from the observed ∼20 Å to ∼30 Å; therefore, we report only lower limits below this threshold. The EGS measurements are instead consistent with a fully ionized IGM. In practice, the z = 7 EGS CDF is fully consistent with the z = 6 CDF measured by DB17. This highlights substantial field-to-field variation in the Lyα transmission at z = 7, supporting a highly inhomogeneous reionization scenario and underscoring the importance of estimating XHI across multiple independent fields.
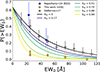 |
Fig. 4. Cumulative distribution functions of Lyα EW0 as a function of the neutral hydrogen fraction, XHI. Blue and orange circles represent the JWST samples at z = 7 from the EGS (Napolitano et al. 2024) and the UDS (this work) fields, respectively. The arrow represents the lower limit we could derive for EW0 = 25 Å, due to incompleteness after Lyα slit loss correction. The DB17 sample at z = 6 (gray diamonds) is shown as a reference for the fully ionized Universe. Error bars were computed following Gehrels (1986). Data points have been slightly shifted in redshift for an easier visualization. The solid black line shows the best-fit exponentially declining function to the DB17 data, corresponding to a null XHI value. Colored lines represent theoretical models derived from Dijkstra et al. (2011), which show the impact of an increasingly neutral IGM. |
For comparison, recent JWST studies that considered multiple fields have independently reported high neutral fractions of ∼0.5–0.8 (e.g., Nakane et al. 2024; Tang et al. 2024b; Jones et al. 2025; Kageura et al. 2025; Umeda et al. 2026) in agreement with results from z ∼ 7 quasars (e.g., Ďurovčíková et al. 2024). Recently, Chen et al. (2025) discussed how the extreme Lyα transmission in the EGS field could be explained by the presence of a single ∼12 pMpc ionized bubble. We emphasize that tighter constraints on XHI require access to the low-EW0 regime of the CDF, where theoretical models show the largest spread. Probing the necessary EW0 values, on the order of 10–15 Å after accounting for Lyα slit losses, appears to be within reach with moderately deeper JWST-NIRSpec observations.
Finally, we note that assuming a non-evolving stellar population and ISM conditions across cosmic time is critical when comparing Lyα visibility in the partially ionized Universe (z ∼ 7 and above) to the post-reionization Universe (z ∼ 6) to infer the IGM neutral hydrogen fraction. However, this assumption may be overly simplistic. For example, Ferrara et al. (2023) proposed the so called attenuation-free model in which early galaxies experience significantly reduced dust attenuation in their ISM once they exceed the Eddington limit. This model accounts for several JWST results, including the overabundance of bright blue sources at early epochs (e.g., Fujimoto et al. 2024; Harikane et al. 2024; Napolitano et al. 2025a). It also predicts that Lyα emission from Lyα-break galaxies at z > 9–10 could be intrinsically enhanced (Ferrara 2024, see the evolution of the predicted super-Eddington galaxy fraction in their Figure 3). The apparent lack of evolution in the Lyα visibility at z = 8 and above, as is shown in Fig. 2 (despite the large uncertainties; see Table 1), may suggest that specific high-redshift galaxy evolution effects, such as those described in Ferrara (2024), begin to play a critical role at these epochs. These effects will be investigated in detail using hydrodynamical simulations of reionization in a future work.
4.4. Ionized bubbles in the UDS field
In a patchy reionization scenario, Lyα photons emitted by a galaxy surrounded by a highly neutral IGM, as described in the previous section, are expected to undergo significant absorption, unless the galaxy resides within a locally ionized region with a radius of ∼0.1–3 pMpc (Mason & Gronke 2020). To investigate the galaxy overdensity conditions that enable Lyα transmission through the IGM, we searched for ionized bubbles at z > 7. In this analysis, we considered all galaxies with detected Lyα emission reported in Table A.1, without applying additional selection criteria based on AGN classification, MUV, or EW0, lim. We assumed that each Lyα-emitting galaxy lies at the center of its own ionized bubble and implemented an iterative approach to identify the most probable set of spectroscopic companions, defining the ionized region. We began by identifying all spectroscopic galaxies within a 2 pMpc sphere (e.g., Lu et al. 2024; Runnholm et al. 2025) around the central Lyα-emitting galaxy, using the distance prescription from Liske (2000). The physical distance, Rphys, to the most distant companion was taken as an upper limit to the bubble size. We then compared Rphys to the ionized bubble radius, Rion, produced after 100 Myrs by the combined ionizing output of the central galaxy and its companions. At each iteration, the furthest companion from the central Lyα emitter was excluded and the procedure was repeated, reassessing Rphys and Rion. We determined the best ionizing bubble configuration as the one that minimizes the quantity |Rion − Rphys|/σ, where σ is the uncertainty of Rion (see below).
To estimate Rion, we followed the prescription from Shapiro & Giroux (1987) and Cen & Haiman (2000), whereby the bubble size is determined by the total number of emitted ionizing photons, neglecting the Hubble expansion and recombination terms, whose timescales are longer than star-formation episodes at z ∼ 7 (see Witstok et al. 2024). The ionizing emissivity of each central source and its spectroscopically confirmed companions was computed using Equation 9 of Mason & Gronke (2020), based on the observed MUV and UV β slope:
where we adopted a spectral slope α = 1 for the ionizing continuum, consistent with measurements of high-redshift galaxies (e.g., Steidel et al. 2014; Feltre et al. 2016). The predicted escape fraction of Lyman continuum photons ( ) was estimated using the empirical relation from Chisholm et al. (2022) and was assumed to remain constant over time. For the z > 7 UDS sub-sample, we found a median predicted escape fraction of 3%, consistent with the median 1–3% range reported by Papovich et al. (2025). While different methods (e.g., Mascia et al. 2023; Jaskot et al. 2024; Giovinazzo et al. 2026) yield a range of predictions for
  , as is noted by Witstok et al. (2025b), the inferred ionized bubble size depends weakly on this parameter. Specifically, since
  , even an order-of-magnitude variation in the assumed escape fraction would affect the derived radius by a factor of ∼2.
We identify two robust (|Rion-Rphys| ≤ 1σ) ionized bubbles centered on RUBIES-22104 (z = 7.29, including six galaxies in total) and CAPERS-142615 (z = 7.77, including three galaxies in total) with corresponding Rion = 0.6 and 0.5 pMpc at 100 Myr, respectively. These values are obviously lower limits, as additional unconfirmed sources, as well as those below the detection limit, also contribute to the ionizing photon budget, further expanding the ionized structures. Figure 5 shows the bubble growth as a function of time for the z = 7.77 bubble, which contains two Lyα emitting galaxies (CAPERS-142615 and CAPERS-133089).
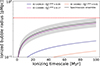 |
Fig. 5. Predicted size of the ionized bubble at z = 7.77 as a function of time since ionizing radiation is switched on. Colored solid lines show the contribution from individual sources, while the black solid line and shaded region represent the cumulative predicted radius and its associated uncertainty. The horizontal red dashed line marks the maximum physical distance between the central Lyα emitting source and its furthest companion. |
We estimated the ionizing contribution of photometric candidates using the ASTRODEEP-JWST catalog (Merlin et al. 2024). To assess the presence of overdensities associated with the ionized bubbles, we evaluated the number of photometric candidates within a cylindrical volume of the Universe spanning [zbubble–0.5, zbubble+0.5]. We compared this result with the expected average number of galaxies based on the UVLF from Bouwens et al. (2015), integrated down to the observed completeness limit of MUV = –18.5 in Merlin et al. (2024). We found significant overdensities associated with the two bubbles at z = 7.29 and 7.77, with N/⟨N⟩ = 3 and 4, respectively. Figure 6 illustrates the positions of spectroscopically confirmed galaxies, photometric candidates, and zoom-ins of the robust ionized regions found at 7 < z < 8 in the UDS field.
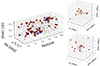 |
Fig. 6. Spatial distribution of spectroscopically confirmed galaxies in the UDS field at 7 < z < 8. Blue and red circles indicate Lyα-emitting and Lyα-break galaxies, respectively. Gray circles mark photometric candidates from the Merlin et al. (2024) catalog. The two robust, spectroscopically confirmed ionized bubbles in the UDS field at z = 7.29 (lower panel) and z = 7.77 (upper panel) are shown as zoom-ins. The extent of each ionized region is represented by a shaded sphere. |
No other robust ionized bubbles were identified with our fiducial method around the remaining high-redshift Lyα emitting galaxies. However, if we relax the agreement criterion between Rion and Rphys down to 3σ, we find a tentative ionized bubble of 1 pMpc at z = 7.44, composed of three Lyα emitting galaxies (RUBIES-59990, RUBIES-930869, and RUBIES-24303) and a non-emitter (RUBIES-971810). The associated N/⟨N⟩ is only 1.3; therefore, this structure remains unconfirmed in our analysis.
Compared to the large EGS ionized regions at z ∼ 7 (2–12 pMpc, Chen et al. 2025), the relatively small ionized bubbles we identify in the UDS field are expected for highly neutral hydrogen IGM environments according to simulations from Lu et al. (2024) (see also, Neyer et al. 2024, 2025). This picture is consistent with the result discussed in Sect. 4.3.
We note that Chen et al. (2025) recently identified overdense structures in the UDS field that are fully consistent with the spatial distribution of galaxies reported in this work. They interpret them as two larger-scale overdensities spanning z = 7.24–7.43 and z = 7.74–7.83, extending over more than 7 and 3 pMpc in radial distance, respectively. Their findings support a consistent picture in which overdense regions are more likely to host strong Lyα-emitting galaxies. The second part of the CAPERS-UDS spectroscopic campaign, scheduled for winter 2025–2026, will significantly improve constraints by expanding the number of confirmed galaxies. This will help distinguish between the two scenarios: isolated, small ionized bubbles or extended, interconnected large-scale overdensities. A refined empirical method of mapping ionized bubbles using Lyα transmission has recently been suggested by Lu et al. (2025) and Nikolić et al. (2025). It requires a spectroscopic identification of > 0.004 galaxies/cMpc3, a 5σ upper limit of ∼30 Å for the Lyα EW0 of the Lyα-break population, and a redshift precision of Δz < 0.015. Among these, the most challenging requirement is the depth, i.e., reaching an EW0, limof ∼ 6 Å that is far below current constraints.
5. Summary
We have presented the results of a systematic study of the evolution of Lyα emission from galaxies at 4.5 ≤ z ≤ 11 in the UDS field. The sample consists of 651 galaxies: 135 are from the CAPERS survey and 516 from other spectroscopic JWST programs whose data are included in the public DAWN JWST Archive. Among the total sample, 531 spectra were obtained from NIRSpec-PRISM configuration, and 120 with medium-resolution configurations. Each source is associated with a secure spectroscopic redshift identified through multiple optical and UV line detections. We flagged broad-line AGN sources by fitting significant Balmer emission lines and using the Bayesian information criterion. Among the 485 galaxies with available Lyα-break information, we identified 73 secure (S/N > 3) Lyα emitting galaxies. Their spectroscopic information is reported in Table A.1. We summarize our main results as follows:
-
We traced the evolution of the number of galaxies with Lyα emission with EW0 > 25 Å (XLyα) across five redshift bins centered at z = 5, 6, 7, 8, and 9. We restricted this calculation to the 216 galaxies with –20.25 < MUV < –18.75, EW0, lim < 25 Å, and no AGN signatures. In the UDS, between z = 5–6 (6–7), the increase (decrease) in XLyα is significant at a level of 1σ (2σ). At z = 5 and z = 6, the average JWST results from multiple fields agree very well with those derived in the UDS field alone, as well as the EGS field alone from Napolitano et al. (2024). This was expected since in the post-reionization Universe the visibility of the Lyα line in galaxies is only driven by their physical properties and not by IGM conditions. On the other hand, at z = 7, field-to-field variations become significant and the difference is exacerbated when comparing the EGS and UDS results individually.
-
A tension remains between the average JWST and ground-based XLyα results at z = 5–6. Comparing to the VLT-FORS2 ground-based sample from De Barros et al. (2017) (DB17), we find no evidence for any bias in sample selection. Instead we suggest that an average Lyα slit loss of ∼35 ± 10% in JWST observations can account for the discrepancy. This is likely due to an instrumental bias introduced when comparing JWST pseudo-slit spectra (0.2 arcsec× 0.46 arcsec) with ground-based data obtained using 1 arcsec slit widths. The results are in agreement with the radiation-hydrodynamical simulation by Bhagwat et al. (2025), when selecting galaxies with no spatial offset between the UV and Lyα emission.
-
We adopted DB17 as a reference sample for the Lyα-break population in an almost fully-ionized Universe at z = 6, and compared it to the z = 7 CDF of Lyα EW0 from JWST. We infer a high neutral hydrogen fraction in the UDS (XHI ∼ 0.7–0.9), while EGS remains compatible with a nearly completely ionized IGM (XHI ∼ 0). This extreme field-to-field variation indicates a highly spatially inhomogeneous reionization process.
-
We identify two ionized bubbles in the UDS field centered on RUBIES-22104 (z = 7.29) and CAPERS-142615 (z = 7.77), with radii of 0.6 and 0.5 pMpc, respectively. These structures show significant photometric overdensities (N/⟨N⟩ = 3 and 4) compared to UVLF expectations. Their smaller sizes, relative to the ∼2–12 pMpc bubble recently identified in the EGS at z ∼ 7, further support the very high XHI in the UDS field.
A systematic census of Lyα emission from spectroscopically confirmed Lyα-break galaxies at high redshift across JWST fields is currently missing. In particular, the spatially inhomogeneous nature of cosmic reionization makes it difficult to converge on a unique reference value for the neutral hydrogen fraction at z ∼ 7. Additionally, the identified instrumental bias between ground-based and JWST-based Lyα measurements introduces further uncertainty when combining results. A critical next step is to compare the current JWST NIRSpec MSA spectroscopic data with a statistical sample of Lyα-emitting galaxies observed using JWST NIRSpec-IFU. Such a comparison would enable the construction of a completely independent, space-based reference sample in the post-reionization Universe, unbiased by Lyα slit losses, which is essential for robustly constraining XHI at high redshifts.
Further progress in characterizing the epoch of reionization will also require deeper or higher-resolution spectra of the Lyα-break population to reach a higher completeness in the space-based CDF of Lyα EW0, down to 10 Å in EW0, lim. As is shown in Fig. 4, the intermediate Lyα EW0 range (10–40 Å) is where model predictions for XHI diverge the most, making it the regime with the greatest potential for observational constraints.
Acknowledgments
We thank the anonymous referee for the constructive feedback provided. LN acknowledges support from grant “Progetti per Avvio alla Ricerca – Tipo 1, Unveiling Cosmic Dawn: Galaxy Evolution with CAPERS” (AR1241906F947685) and from PRIN 2022 MUR project 2022CB3PJ3 – First Light And Galaxy aSsembly (FLAGS) funded by the European Union – Next Generation EU. LN, LP, AB, and BC acknowledge support from the ERC synergy grant 101166930 – RECAP. This work is based on observations made with the NASA/ESA/CSA James Webb Space Telescope, obtained at the Space Telescope Science Institute, which is operated by the Association of Universities for Research in Astronomy, Incorporated, under NASA contract NAS5-03127. These observations are associated with programs #6368, #4233, #1215, #2565, and #3543. Support for program number GO-6368 was provided through a grant from the STScI under NASA contract NAS5-03127. The data were obtained from the Mikulski Archive for Space Telescopes (MAST) at the Space Telescope Science Institute. These observations can be accessed via DOI. Some of the data products presented in this work were retrieved from the Dawn JWST Archive (DJA). DJA is an initiative of the Cosmic Dawn Center (DAWN), which is funded by the Danish National Research Foundation under grant DNRF140.
References
- Anders, P., & Fritze-v Alvensleben, U. 2003, A&A, 401, 1063 [NASA ADS] [CrossRef] [EDP Sciences] [Google Scholar]
- Arrabal Haro, P., Rodríguez Espinosa, J. M., Muñoz-Tuñón, C., et al. 2018, MNRAS, 478, 3740 [NASA ADS] [CrossRef] [Google Scholar]
- Arrabal Haro, P., Dickinson, M., Finkelstein, S. L., et al. 2023a, ApJ, 951, L22 [NASA ADS] [CrossRef] [Google Scholar]
- Arrabal Haro, P., Dickinson, M., Finkelstein, S. L., et al. 2023b, Nature, 622, 707 [NASA ADS] [CrossRef] [Google Scholar]
- Becker, G. D., Bolton, J. S., Madau, P., et al. 2015, MNRAS, 447, 3402 [Google Scholar]
- Becker, G. D., Bolton, J. S., Zhu, Y., & Hashemi, S. 2024, MNRAS, 533, 1525 [Google Scholar]
- Bhagwat, A., Costa, T., Ciardi, B., Pakmor, R., & Garaldi, E. 2024, MNRAS, 531, 3406 [NASA ADS] [CrossRef] [Google Scholar]
- Bhagwat, A., Napolitano, L., Pentericci, L., Ciardi, B., & Costa, T. 2025, MNRAS, 542, 128 [Google Scholar]
- Bogdán, Á., Goulding, A. D., Natarajan, P., et al. 2024, Nat. Astron., 8, 126 [Google Scholar]
- Bolan, P., Lemaux, B. C., Mason, C., et al. 2022, MNRAS, 517, 3263 [Google Scholar]
- Bosman, S. E. I., Davies, F. B., Becker, G. D., et al. 2022, MNRAS, 514, 55 [NASA ADS] [CrossRef] [Google Scholar]
- Bouwens, R. J., Illingworth, G. D., Oesch, P. A., et al. 2015, ApJ, 803, 34 [Google Scholar]
- Brammer, G. 2022, https://doi.org/10.5281/zenodo.7299501 [Google Scholar]
- Bruzual, G., & Charlot, S. 2003, MNRAS, 344, 1000 [NASA ADS] [CrossRef] [Google Scholar]
- Bunker, A. J., Saxena, A., Cameron, A. J., et al. 2023, A&A, 677, A88 [NASA ADS] [CrossRef] [EDP Sciences] [Google Scholar]
- Bushouse, H., Eisenhamer, J., Dencheva, N., et al. 2025, https://doi.org/10.5281/zenodo.6984365 [Google Scholar]
- Calzetti, D., Armus, L., Bohlin, R. C., et al. 2000, ApJ, 533, 682 [NASA ADS] [CrossRef] [Google Scholar]
- Carnall, A. C., Cullen, F., McLure, R. J., et al. 2024, MNRAS, 534, 325 [NASA ADS] [CrossRef] [Google Scholar]
- Carniani, S., Hainline, K., D’Eugenio, F., et al. 2024, Nature, 633, 318 [CrossRef] [Google Scholar]
- Castellano, M., Sommariva, V., Fontana, A., et al. 2014, A&A, 566, A19 [NASA ADS] [CrossRef] [EDP Sciences] [Google Scholar]
- Castellano, M., Dayal, P., Pentericci, L., et al. 2016, ApJ, 818, L3 [NASA ADS] [CrossRef] [Google Scholar]
- Castellano, M., Napolitano, L., Fontana, A., et al. 2024, ApJ, 972, 143 [Google Scholar]
- Castellano, M., Fontana, A., Merlin, E., et al. 2025, A&A, 704, A158 [NASA ADS] [CrossRef] [EDP Sciences] [Google Scholar]
- Cen, R., & Haiman, Z. 2000, ApJ, 542, L75 [NASA ADS] [CrossRef] [Google Scholar]
- Chabrier, G. 2003, PASP, 115, 763 [Google Scholar]
- Chen, Z., Stark, D. P., Mason, C., et al. 2024, MNRAS, 528, 7052 [CrossRef] [Google Scholar]
- Chen, Z., Stark, D. P., Mason, C. A., et al. 2025, ApJ, submitted [arXiv:2505.24080] [Google Scholar]
- Chisholm, J., Saldana-Lopez, A., Flury, S., et al. 2022, MNRAS, 517, 5104 [CrossRef] [Google Scholar]
- Curtis-Lake, E., Carniani, S., Cameron, A., et al. 2023, Nat. Astron., 7, 622 [NASA ADS] [CrossRef] [Google Scholar]
- De Barros, S., Pentericci, L., Vanzella, E., et al. 2017, A&A, 608, A123 [NASA ADS] [CrossRef] [EDP Sciences] [Google Scholar]
- de Graaff, A., Brammer, G., Weibel, A., et al. 2025, A&A, 697, A189 [NASA ADS] [CrossRef] [EDP Sciences] [Google Scholar]
- D’Eugenio, F., Maiolino, R., Carniani, S., et al. 2024, A&A, 689, A152 [NASA ADS] [CrossRef] [EDP Sciences] [Google Scholar]
- Dijkstra, M. 2017, arXiv e-prints [arXiv:1704.03416] [Google Scholar]
- Dijkstra, M., Mesinger, A., & Wyithe, J. S. B. 2011, MNRAS, 414, 2139 [NASA ADS] [CrossRef] [Google Scholar]
- Dijkstra, M., Wyithe, S., Haiman, Z., Mesinger, A., & Pentericci, L. 2014, MNRAS, 440, 3309 [CrossRef] [Google Scholar]
- Donnan, C. T., Dickinson, M., Taylor, A. J., et al. 2025, ApJ, 993, 224 [Google Scholar]
- Dottorini, D., Calabrò, A., Pentericci, L., et al. 2025, A&A, 698, A234 [NASA ADS] [CrossRef] [EDP Sciences] [Google Scholar]
- Ďurovčíková, D., Eilers, A.-C., Chen, H., et al. 2024, ApJ, 969, 162 [Google Scholar]
- Ellis, R. S. 2025, arXiv e-prints [arXiv:2508.16948] [Google Scholar]
- Endsley, R., & Stark, D. P. 2022, MNRAS, 511, 6042 [NASA ADS] [CrossRef] [Google Scholar]
- Feltre, A., Charlot, S., & Gutkin, J. 2016, MNRAS, 456, 3354 [Google Scholar]
- Ferrara, A. 2024, A&A, 684, A207 [NASA ADS] [CrossRef] [EDP Sciences] [Google Scholar]
- Ferrara, A., Pallottini, A., & Dayal, P. 2023, MNRAS, 522, 3986 [NASA ADS] [CrossRef] [Google Scholar]
- Finkelstein, S. L., Papovich, C., Dickinson, M., et al. 2013, Nature, 502, 524 [CrossRef] [Google Scholar]
- Fontana, A., D’Odorico, S., Poli, F., et al. 2000, AJ, 120, 2206 [NASA ADS] [CrossRef] [Google Scholar]
- Fontana, A., Vanzella, E., Pentericci, L., et al. 2010, ApJ, 725, L205 [Google Scholar]
- Foreman-Mackey, D., Hogg, D. W., Lang, D., & Goodman, J. 2013, PASP, 125, 306 [Google Scholar]
- Fujimoto, S., Wang, B., Weaver, J. R., et al. 2024, ApJ, 977, 250 [NASA ADS] [CrossRef] [Google Scholar]
- Fuller, S., Lemaux, B. C., Bradač, M., et al. 2020, ApJ, 896, 156 [NASA ADS] [CrossRef] [Google Scholar]
- Gardner, J. P., Mather, J. C., Clampin, M., et al. 2006, Space Sci. Rev., 123, 485 [Google Scholar]
- Gardner, J. P., Mather, J. C., & Abbott 2023, PASP, 135, 068001 [NASA ADS] [CrossRef] [Google Scholar]
- Gehrels, N. 1986, ApJ, 303, 336 [Google Scholar]
- Giovinazzo, E., Oesch, P. A., Weibel, A., et al. 2026, A&A, 707, A352 [NASA ADS] [CrossRef] [EDP Sciences] [Google Scholar]
- Grogin, N. A., Kocevski, D. D., Faber, S. M., et al. 2011, ApJS, 197, 35 [NASA ADS] [CrossRef] [Google Scholar]
- Gutkin, J., Charlot, S., & Bruzual, G. 2016, MNRAS, 462, 1757 [Google Scholar]
- Hainline, K. N., D’Eugenio, F., Jakobsen, P., et al. 2024, ApJ, 976, 160 [NASA ADS] [CrossRef] [Google Scholar]
- Harikane, Y., Nakajima, K., Ouchi, M., et al. 2024, ApJ, 960, 56 [NASA ADS] [CrossRef] [Google Scholar]
- Heintz, K. E., Watson, D., Brammer, G., et al. 2024, Science, 384, 890 [NASA ADS] [CrossRef] [Google Scholar]
- Hirschmann, M., Charlot, S., Feltre, A., et al. 2019, MNRAS, 487, 333 [NASA ADS] [CrossRef] [Google Scholar]
- Hirschmann, M., Charlot, S., Feltre, A., et al. 2023, MNRAS, 526, 3610 [NASA ADS] [CrossRef] [Google Scholar]
- Hoag, A., Treu, T., Pentericci, L., et al. 2019, MNRAS, 488, 706 [Google Scholar]
- Horne, K. 1986, PASP, 98, 609 [Google Scholar]
- Hsiao, T. Y.-Y., Álvarez-Márquez, J., Coe, D., et al. 2024, ApJ, 973, 81 [NASA ADS] [CrossRef] [Google Scholar]
- Hu, W., Wang, J., Zheng, Z.-Y., et al. 2017, ApJ, 845, L16 [CrossRef] [Google Scholar]
- Hviding, R. E., de Graaff, A., Miller, T. B., et al. 2025, A&A, 702, A57 [NASA ADS] [CrossRef] [EDP Sciences] [Google Scholar]
- Jakobsen, P., Ferruit, P., Alves de Oliveira, C., et al. 2022, A&A, 661, A80 [NASA ADS] [CrossRef] [EDP Sciences] [Google Scholar]
- Jaskot, A. E., Silveyra, A. C., Plantinga, A., et al. 2024, ApJ, 973, 111 [NASA ADS] [CrossRef] [Google Scholar]
- Jones, G. C., Bunker, A. J., Saxena, A., et al. 2024, A&A, 683, A238 [NASA ADS] [CrossRef] [EDP Sciences] [Google Scholar]
- Jones, G. C., Bunker, A. J., Saxena, A., et al. 2025, MNRAS, 536, 2355 [Google Scholar]
- Jung, I., Finkelstein, S. L., Dickinson, M., et al. 2020, ApJ, 904, 144 [NASA ADS] [CrossRef] [Google Scholar]
- Jung, I., Finkelstein, S. L., Larson, R. L., et al. 2022, ApJ, submitted [arXiv:2212.09850] [Google Scholar]
- Jung, I., Finkelstein, S. L., Arrabal Haro, P., et al. 2024, ApJ, 967, 73 [NASA ADS] [CrossRef] [Google Scholar]
- Juodžbalis, I., Maiolino, R., Baker, W. M., et al. 2026, MNRAS, 546, 38 [Google Scholar]
- Kageura, Y., Ouchi, M., Nakane, M., et al. 2025, ApJS, 278, 33 [Google Scholar]
- Kawinwanichakij, L., Glazebrook, K., Nanayakkara, T., et al. 2026, ApJ, 997, 29 [Google Scholar]
- Keating, L. C., Weinberger, L. H., Kulkarni, G., et al. 2020, MNRAS, 491, 1736 [NASA ADS] [CrossRef] [Google Scholar]
- Kocevski, D. D., Hasinger, G., Brightman, M., et al. 2018, ApJS, 236, 48 [CrossRef] [Google Scholar]
- Koekemoer, A. M., Faber, S. M., Ferguson, H. C., et al. 2011, ApJS, 197, 36 [NASA ADS] [CrossRef] [Google Scholar]
- Kokorev, V., Atek, H., Chisholm, J., et al. 2025a, ApJ, 983, L22 [Google Scholar]
- Kokorev, V., Chávez Ortiz, Ó. A., Taylor, A. J., et al. 2025b, ApJ, 988, L10 [Google Scholar]
- Kornei, K. A., Shapley, A. E., Erb, D. K., et al. 2010, ApJ, 711, 693 [NASA ADS] [CrossRef] [Google Scholar]
- Kovács, O. E., Bogdán, Á., Natarajan, P., et al. 2024, ApJ, 965, L21 [CrossRef] [Google Scholar]
- Kusakabe, H., Blaizot, J., Garel, T., et al. 2020, A&A, 638, A12 [NASA ADS] [CrossRef] [EDP Sciences] [Google Scholar]
- Kusakabe, H., Verhamme, A., Blaizot, J., et al. 2022, A&A, 660, A44 [NASA ADS] [CrossRef] [EDP Sciences] [Google Scholar]
- Larson, R. L., Finkelstein, S. L., Hutchison, T. A., et al. 2022, ApJ, 930, 104 [NASA ADS] [CrossRef] [Google Scholar]
- Lawrence, A., Warren, S. J., Almaini, O., et al. 2007, MNRAS, 379, 1599 [Google Scholar]
- Leclercq, F., Bacon, R., Wisotzki, L., et al. 2017, A&A, 608, A8 [NASA ADS] [CrossRef] [EDP Sciences] [Google Scholar]
- Lemaux, B. C., Fuller, S., Bradač, M., et al. 2021, MNRAS, 504, 3662 [NASA ADS] [CrossRef] [Google Scholar]
- Leonova, E., Oesch, P. A., Qin, Y., et al. 2022, MNRAS, 515, 5790 [NASA ADS] [CrossRef] [Google Scholar]
- Liske, J. 2000, MNRAS, 319, 557 [NASA ADS] [CrossRef] [Google Scholar]
- Lu, T.-Y., Mason, C. A., Hutter, A., et al. 2024, MNRAS, 528, 4872 [CrossRef] [Google Scholar]
- Lu, T.-Y., Mason, C. A., Mesinger, A., et al. 2025, A&A, 697, A69 [NASA ADS] [CrossRef] [EDP Sciences] [Google Scholar]
- Madau, P., & Haardt, F. 2024, ApJ, 976, L24 [Google Scholar]
- Maiolino, R., Scholtz, J., Witstok, J., et al. 2024, Nature, 627, 59 [NASA ADS] [CrossRef] [Google Scholar]
- Malhotra, S., & Rhoads, J. E. 2006, ApJ, 647, L95 [NASA ADS] [CrossRef] [Google Scholar]
- Mascia, S., Pentericci, L., Calabrò, A., et al. 2023, A&A, 672, A155 [NASA ADS] [CrossRef] [EDP Sciences] [Google Scholar]
- Mason, C. A., & Gronke, M. 2020, MNRAS, 499, 1395 [Google Scholar]
- Mason, C. A., Treu, T., de Barros, S., et al. 2018, ApJ, 857, L11 [Google Scholar]
- Mason, C. A., Fontana, A., Treu, T., et al. 2019, MNRAS, 485, 3947 [NASA ADS] [CrossRef] [Google Scholar]
- Mazzolari, G., Übler, H., Maiolino, R., et al. 2024, A&A, 691, A345 [NASA ADS] [CrossRef] [EDP Sciences] [Google Scholar]
- Mazzolari, G., Scholtz, J., Maiolino, R., et al. 2025, A&A, 700, A12 [NASA ADS] [CrossRef] [EDP Sciences] [Google Scholar]
- Melinder, J., Östlin, G., Hayes, M., et al. 2023, ApJS, 266, 15 [NASA ADS] [CrossRef] [Google Scholar]
- Merlin, E., Santini, P., Paris, D., et al. 2024, A&A, 691, A240 [NASA ADS] [CrossRef] [EDP Sciences] [Google Scholar]
- Miralda-Escudé, J. 1998, ApJ, 501, 15 [CrossRef] [Google Scholar]
- Morishita, T., Stiavelli, M., Mason, C. A., et al. 2026, ApJ, 998, 175 [Google Scholar]
- Naidu, R. P., Oesch, P. A., Brammer, G., et al. 2026, Open J. Astrophys., 9, 56033 [Google Scholar]
- Nakajima, K., & Maiolino, R. 2022, MNRAS, 513, 5134 [NASA ADS] [CrossRef] [Google Scholar]
- Nakane, M., Ouchi, M., Nakajima, K., et al. 2024, ApJ, 967, 28 [NASA ADS] [CrossRef] [Google Scholar]
- Napolitano, L., Pentericci, L., Calabrò, A., et al. 2023, A&A, 677, A138 [NASA ADS] [CrossRef] [EDP Sciences] [Google Scholar]
- Napolitano, L., Pentericci, L., Santini, P., et al. 2024, A&A, 688, A106 [NASA ADS] [CrossRef] [EDP Sciences] [Google Scholar]
- Napolitano, L., Castellano, M., Pentericci, L., et al. 2025a, A&A, 693, A50 [NASA ADS] [CrossRef] [EDP Sciences] [Google Scholar]
- Napolitano, L., Castellano, M., Pentericci, L., et al. 2025b, ApJ, 989, 75 [Google Scholar]
- Neyer, M., Smith, A., Kannan, R., et al. 2024, MNRAS, 531, 2943 [Google Scholar]
- Neyer, M., Smith, A., Vogelsberger, M., et al. 2025, arXiv e-prints [arXiv:2510.18946] [Google Scholar]
- Nikolić, I., Mesinger, A., Mason, C. A., et al. 2025, A&A, 699, A323 [Google Scholar]
- Ning, Y., Cai, Z., Lin, X., et al. 2024, ApJ, 963, L38 [NASA ADS] [CrossRef] [Google Scholar]
- Oesch, P. A., van Dokkum, P. G., Illingworth, G. D., et al. 2015, ApJ, 804, L30 [Google Scholar]
- Oke, J. B., & Gunn, J. E. 1983, ApJ, 266, 713 [NASA ADS] [CrossRef] [Google Scholar]
- Ono, Y., Ouchi, M., Mobasher, B., et al. 2012, ApJ, 744, 83 [Google Scholar]
- Ouchi, M., Shimasaku, K., Furusawa, H., et al. 2010, ApJ, 723, 869 [Google Scholar]
- Ouchi, M., Harikane, Y., Shibuya, T., et al. 2018, PASJ, 70, S13 [Google Scholar]
- Ouchi, M., Ono, Y., & Shibuya, T. 2020, ARA&A, 58, 617 [Google Scholar]
- Papovich, C., Cole, J. W., Hu, W., et al. 2025, ApJ, accepted [arXiv:2505.08870] [Google Scholar]
- Pentericci, L., Fontana, A., Vanzella, E., et al. 2011, ApJ, 743, 132 [NASA ADS] [CrossRef] [Google Scholar]
- Pentericci, L., Vanzella, E., Fontana, A., et al. 2014, ApJ, 793, 113 [NASA ADS] [CrossRef] [Google Scholar]
- Pentericci, L., McLure, R. J., Garilli, B., et al. 2018a, A&A, 616, A174 [NASA ADS] [CrossRef] [EDP Sciences] [Google Scholar]
- Pentericci, L., Vanzella, E., Castellano, M., et al. 2018b, A&A, 619, A147 [NASA ADS] [CrossRef] [EDP Sciences] [Google Scholar]
- Pérez-González, P. G., Östlin, G., Costantin, L., et al. 2025, ApJ, 991, 179 [Google Scholar]
- Planck Collaboration VI. 2020, A&A, 641, A6 [NASA ADS] [CrossRef] [EDP Sciences] [Google Scholar]
- Pollock, C. L., Gottumukkala, R., Heintz, K. E., et al. 2026, A&A, in press https://doi.org/10.1051/0004-6361/202556032 [Google Scholar]
- Roberts-Borsani, G. W., Bouwens, R. J., Oesch, P. A., et al. 2016, ApJ, 823, 143 [NASA ADS] [CrossRef] [Google Scholar]
- Runnholm, A., Hayes, M. J., Mehta, V., et al. 2025, ApJ, 984, 95 [Google Scholar]
- Santini, P., Fontana, A., Castellano, M., et al. 2023, ApJ, 942, L27 [NASA ADS] [CrossRef] [Google Scholar]
- Saxena, A., Bunker, A. J., Jones, G. C., et al. 2024, A&A, 684, A84 [NASA ADS] [CrossRef] [EDP Sciences] [Google Scholar]
- Schaerer, D., & de Barros, S. 2009, A&A, 502, 423 [NASA ADS] [CrossRef] [EDP Sciences] [Google Scholar]
- Schenker, M. A., Stark, D. P., Ellis, R. S., et al. 2012, ApJ, 744, 179 [Google Scholar]
- Schenker, M. A., Ellis, R. S., Konidaris, N. P., & Stark, D. P. 2014, ApJ, 795, 20 [NASA ADS] [CrossRef] [Google Scholar]
- Scholtz, J., Maiolino, R., D’Eugenio, F., et al. 2025, A&A, 697, A175 [NASA ADS] [CrossRef] [EDP Sciences] [Google Scholar]
- Shapiro, P. R., & Giroux, M. L. 1987, ApJ, 321, L107 [NASA ADS] [CrossRef] [Google Scholar]
- Spina, B., Bosman, S. E. I., Davies, F. B., Gaikwad, P., & Zhu, Y. 2024, A&A, 688, L26 [NASA ADS] [CrossRef] [EDP Sciences] [Google Scholar]
- Stark, D. P., Ellis, R. S., Chiu, K., Ouchi, M., & Bunker, A. 2010, MNRAS, 408, 1628 [Google Scholar]
- Stark, D. P., Ellis, R. S., & Ouchi, M. 2011, ApJ, 728, L2 [Google Scholar]
- Steidel, C. C., Rudie, G. C., Strom, A. L., et al. 2014, ApJ, 795, 165 [Google Scholar]
- Tang, M., Stark, D. P., Chen, Z., et al. 2023, MNRAS, 526, 1657 [NASA ADS] [CrossRef] [Google Scholar]
- Tang, M., Stark, D. P., Ellis, R. S., et al. 2024a, MNRAS, 531, 2701 [NASA ADS] [CrossRef] [Google Scholar]
- Tang, M., Stark, D. P., Topping, M. W., Mason, C., & Ellis, R. S. 2024b, ApJ, 975, 208 [NASA ADS] [CrossRef] [Google Scholar]
- Tang, M., Stark, D. P., Mason, C. A., et al. 2025, ApJ, submitted [arXiv:2507.08245] [Google Scholar]
- Taylor, J., & Lidz, A. 2014, MNRAS, 437, 2542 [NASA ADS] [CrossRef] [Google Scholar]
- Taylor, A. J., Finkelstein, S. L., Kocevski, D. D., et al. 2025a, ApJ, 986, 165 [Google Scholar]
- Taylor, A. J., Kokorev, V., Kocevski, D. D., et al. 2025b, ApJ, 989, L7 [Google Scholar]
- Tilvi, V., Papovich, C., Finkelstein, S. L., et al. 2014, ApJ, 794, 5 [Google Scholar]
- Tilvi, V., Malhotra, S., Rhoads, J. E., et al. 2020, ApJ, 891, L10 [NASA ADS] [CrossRef] [Google Scholar]
- Topping, M. W., Stark, D. P., Endsley, R., et al. 2024, MNRAS, 529, 4087 [NASA ADS] [CrossRef] [Google Scholar]
- Umeda, H., Ouchi, M., Nakajima, K., et al. 2024, ApJ, 971, 124 [NASA ADS] [CrossRef] [Google Scholar]
- Umeda, H., Ouchi, M., Kikuta, S., et al. 2025, ApJS, 277, 37 [Google Scholar]
- Umeda, H., Ouchi, M., Kageura, Y., et al. 2026, ApJ, 997, 86 [Google Scholar]
- Wang, B., Fujimoto, S., Labbé, I., et al. 2023, ApJ, 957, L34 [NASA ADS] [CrossRef] [Google Scholar]
- Whitler, L., Stark, D. P., Topping, M. W., et al. 2025, ApJ, 992, 63 [Google Scholar]
- Witstok, J., Smit, R., Saxena, A., et al. 2024, A&A, 682, A40 [NASA ADS] [CrossRef] [EDP Sciences] [Google Scholar]
- Witstok, J., Jakobsen, P., Maiolino, R., et al. 2025a, Nature, 639, 897 [Google Scholar]
- Witstok, J., Maiolino, R., Smit, R., et al. 2025b, MNRAS, 536, 27 [Google Scholar]
Appendix A: Spectroscopic properties and Lyα line profiles of UDS Lyα emitting galaxies
In this appendix, we present in Table A.1 the measured properties of the 73 Lyα emitting galaxies at z > 4.5 identified in the UDS sample. Their fit Lyα line profiles are shown in Fig. A.1. We report galaxies in order of descending redshift.
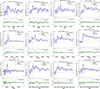 |
Fig. A.1. Fit Lyα line profiles of the 73 galaxies with robust S/N > 3 Lyα emission. The blue solid line and shaded area denote the flux and error measurement as a function of the observed wavelength. The best fit-model is represented by the orange solid line, while the fit continuum value at the Lyα line peak is represented by the star symbol. The vertical red line indicates the Lyα expected wavelength at the systemic redshift of the source. The lower panels show the residuals from the fit. |
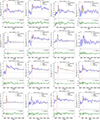 |
Fig. A.1. continued. |
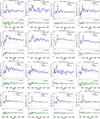 |
Fig. A.1. continued. |
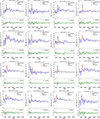 |
Fig. A.1. continued. |
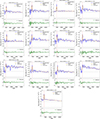 |
Fig. A.1. continued. |
Spectroscopic properties of the S/N> 3 Lyα emitting galaxies in the UDS sample.
We report the observed EW0 without correcting for Lyα slit losses. MUV values are derived from spectra and include the photometric correction. Symbols: ‡ - source identified as AGN; - BLAGN also identified in Taylor et al. (2025a), Hviding et al. (2025); † - source in an identified ionized bubble; + - Lyα emission discussed in Chen et al. (2025); ★ - β slope derived using the Dottorini et al. (2025) relation.
All Tables
Observed fraction of Lyα-emitting galaxies with EW0 > 25 Å as a function of redshift.
Spectroscopic properties of the S/N> 3 Lyα emitting galaxies in the UDS sample.
All Figures
|
Fig. 1. Left: Absolute UV magnitude as a function of redshift in the UDS sample. The 73 galaxies with robust S/N > 3 Lyα detection are shown in blue, while the rest of the population is shown in red. Right: Distribution of Lyα EW0 as a function of MUV. Galaxies in the UDS with S/N > 3 are shown as circles, while upper limits EW0, lim are shown as triangles. They are color-coded by spectroscopic redshift. For comparison, we report CEERS-EGS emitters (gray squares) and upper limits (gray triangles) from Napolitano et al. (2024). The dashed black lines at MUV = –20.25 and –18.75 define the bright and faint regimes. The UDS sample is complete down to MUV = –18.25, indicated by the solid red line. |
| In the text | |
|
Fig. 2. Redshift evolution of the fraction of galaxies with observed EW0 > 25 Å. Results from this work are shown as orange circles. No correction for Lyα slit losses was applied. Error bars were computed using binomial statistics following Gehrels (1986). Colored points represent JWST estimates (Nakane et al. 2024; Napolitano et al. 2024; Tang et al. 2024b; Jones et al. 2025; Kageura et al. 2025), while open symbols with black edges correspond to ground-based literature results (Stark et al. 2011; Tilvi et al. 2014; De Barros et al. 2017; Pentericci et al. 2018b; Mason et al. 2019; Fuller et al. 2020; Kusakabe et al. 2020; Tang et al. 2024a). Data points have been slightly shifted in redshift for clarity. |
| In the text | |
|
Fig. 3. Left: UV β slope as a function of MUV for galaxies in the redshift range 5 < z < 6.5 (circles), matching the selection in De Barros et al. (2017) (stars). The continuous black lines at MUV = –21 and –18.75 mark the range considered. Galaxies with Lyα EW0 > 25 Å are shown in blue, while the rest of the population is shown in red. The best-fit relation and 1σ uncertainty at z ∼ 6 from Topping et al. (2024) and Dottorini et al. (2025) are overplotted in black and green, respectively. Right: Cumulative distribution functions of Lyα EW0 at z ∼ 6. The DB17 and JWST Lyα-break samples are shown as stars and circles, respectively. Error bars were computed following Gehrels (1986). The dashed black line shows the best-fit exponentially declining function to the DB17 data, corresponding to a case with no Lyα slit loss (T = 1). The dashed blue line and shaded blue region represent the JWST extracted CDF assuming T = 0.65 ± 0.10. The dashed red area indicates the EW0 range where a direct comparison is not possible due to the JWST completeness limit. |
| In the text | |
|
Fig. 4. Cumulative distribution functions of Lyα EW0 as a function of the neutral hydrogen fraction, XHI. Blue and orange circles represent the JWST samples at z = 7 from the EGS (Napolitano et al. 2024) and the UDS (this work) fields, respectively. The arrow represents the lower limit we could derive for EW0 = 25 Å, due to incompleteness after Lyα slit loss correction. The DB17 sample at z = 6 (gray diamonds) is shown as a reference for the fully ionized Universe. Error bars were computed following Gehrels (1986). Data points have been slightly shifted in redshift for an easier visualization. The solid black line shows the best-fit exponentially declining function to the DB17 data, corresponding to a null XHI value. Colored lines represent theoretical models derived from Dijkstra et al. (2011), which show the impact of an increasingly neutral IGM. |
| In the text | |
|
Fig. 5. Predicted size of the ionized bubble at z = 7.77 as a function of time since ionizing radiation is switched on. Colored solid lines show the contribution from individual sources, while the black solid line and shaded region represent the cumulative predicted radius and its associated uncertainty. The horizontal red dashed line marks the maximum physical distance between the central Lyα emitting source and its furthest companion. |
| In the text | |
|
Fig. 6. Spatial distribution of spectroscopically confirmed galaxies in the UDS field at 7 < z < 8. Blue and red circles indicate Lyα-emitting and Lyα-break galaxies, respectively. Gray circles mark photometric candidates from the Merlin et al. (2024) catalog. The two robust, spectroscopically confirmed ionized bubbles in the UDS field at z = 7.29 (lower panel) and z = 7.77 (upper panel) are shown as zoom-ins. The extent of each ionized region is represented by a shaded sphere. |
| In the text | |
|
Fig. A.1. Fit Lyα line profiles of the 73 galaxies with robust S/N > 3 Lyα emission. The blue solid line and shaded area denote the flux and error measurement as a function of the observed wavelength. The best fit-model is represented by the orange solid line, while the fit continuum value at the Lyα line peak is represented by the star symbol. The vertical red line indicates the Lyα expected wavelength at the systemic redshift of the source. The lower panels show the residuals from the fit. |
| In the text | |
|
Fig. A.1. continued. |
| In the text | |
|
Fig. A.1. continued. |
| In the text | |
|
Fig. A.1. continued. |
| In the text | |
|
Fig. A.1. continued. |
| In the text | |
Current usage metrics show cumulative count of Article Views (full-text article views including HTML views, PDF and ePub downloads, according to the available data) and Abstracts Views on Vision4Press platform.
Data correspond to usage on the plateform after 2015. The current usage metrics is available 48-96 hours after online publication and is updated daily on week days.
Initial download of the metrics may take a while.