Fig. 3.
Download original image
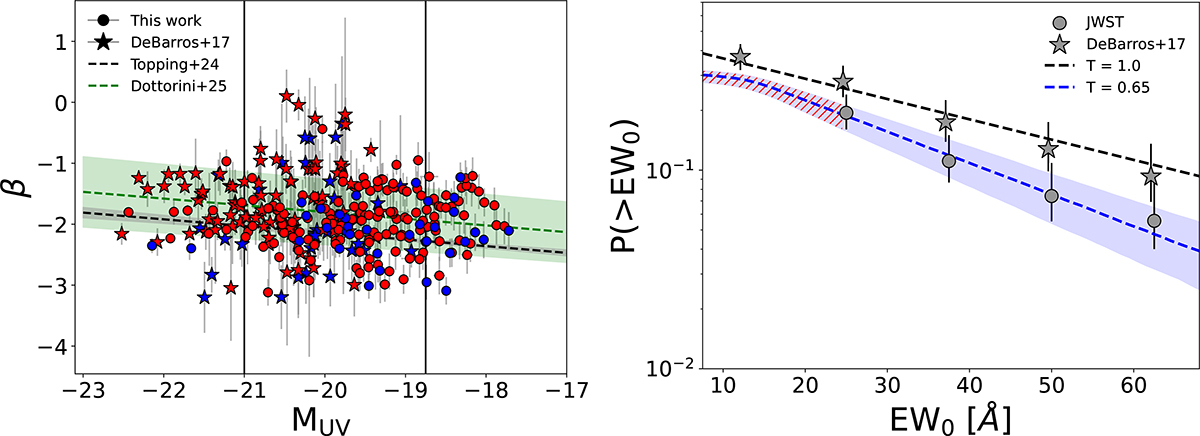
Left: UV β slope as a function of MUV for galaxies in the redshift range 5 < z < 6.5 (circles), matching the selection in De Barros et al. (2017) (stars). The continuous black lines at MUV = –21 and –18.75 mark the range considered. Galaxies with Lyα EW0 > 25 Å are shown in blue, while the rest of the population is shown in red. The best-fit relation and 1σ uncertainty at z ∼ 6 from Topping et al. (2024) and Dottorini et al. (2025) are overplotted in black and green, respectively. Right: Cumulative distribution functions of Lyα EW0 at z ∼ 6. The DB17 and JWST Lyα-break samples are shown as stars and circles, respectively. Error bars were computed following Gehrels (1986). The dashed black line shows the best-fit exponentially declining function to the DB17 data, corresponding to a case with no Lyα slit loss (T = 1). The dashed blue line and shaded blue region represent the JWST extracted CDF assuming T = 0.65 ± 0.10. The dashed red area indicates the EW0 range where a direct comparison is not possible due to the JWST completeness limit.
Current usage metrics show cumulative count of Article Views (full-text article views including HTML views, PDF and ePub downloads, according to the available data) and Abstracts Views on Vision4Press platform.
Data correspond to usage on the plateform after 2015. The current usage metrics is available 48-96 hours after online publication and is updated daily on week days.
Initial download of the metrics may take a while.