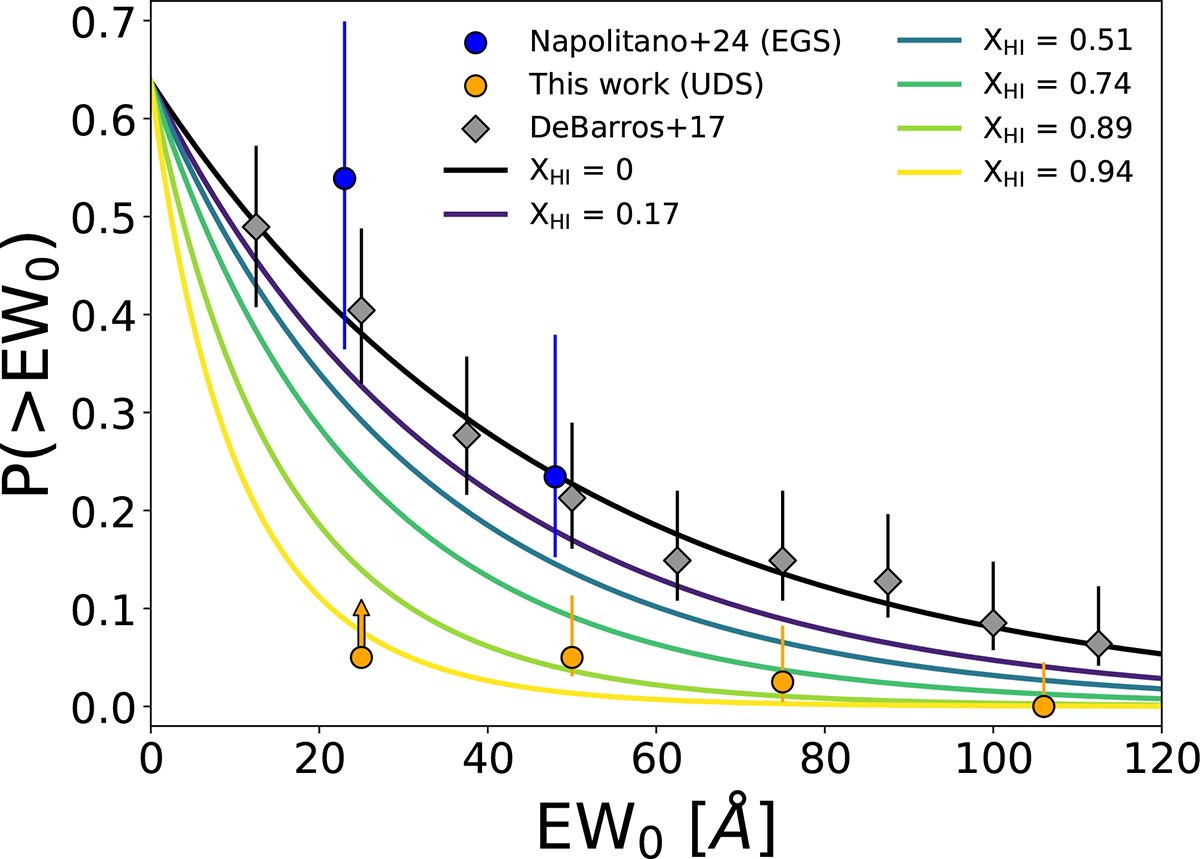
Fig. 4.
Download original image
Cumulative distribution functions of Lyα EW0 as a function of the neutral hydrogen fraction, XHI. Blue and orange circles represent the JWST samples at z = 7 from the EGS (Napolitano et al. 2024) and the UDS (this work) fields, respectively. The arrow represents the lower limit we could derive for EW0 = 25 Å, due to incompleteness after Lyα slit loss correction. The DB17 sample at z = 6 (gray diamonds) is shown as a reference for the fully ionized Universe. Error bars were computed following Gehrels (1986). Data points have been slightly shifted in redshift for an easier visualization. The solid black line shows the best-fit exponentially declining function to the DB17 data, corresponding to a null XHI value. Colored lines represent theoretical models derived from Dijkstra et al. (2011), which show the impact of an increasingly neutral IGM.
Current usage metrics show cumulative count of Article Views (full-text article views including HTML views, PDF and ePub downloads, according to the available data) and Abstracts Views on Vision4Press platform.
Data correspond to usage on the plateform after 2015. The current usage metrics is available 48-96 hours after online publication and is updated daily on week days.
Initial download of the metrics may take a while.