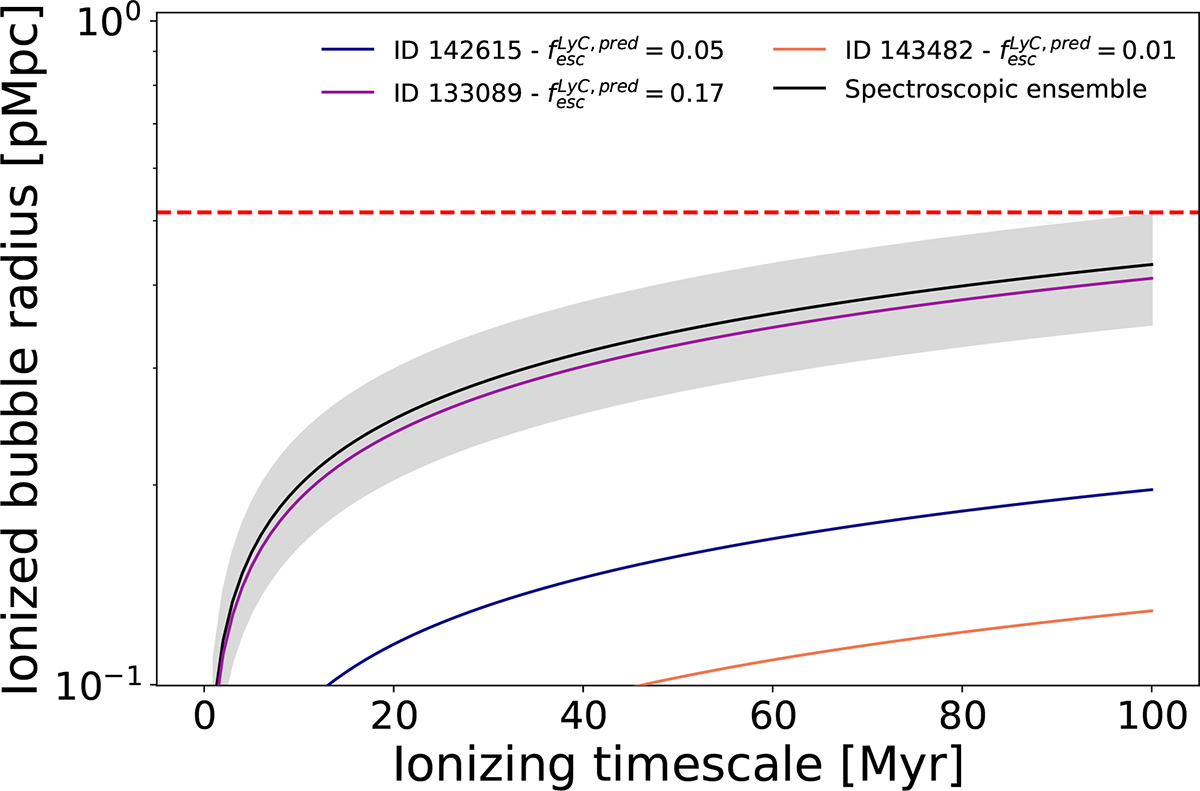
Fig. 5.
Download original image
Predicted size of the ionized bubble at z = 7.77 as a function of time since ionizing radiation is switched on. Colored solid lines show the contribution from individual sources, while the black solid line and shaded region represent the cumulative predicted radius and its associated uncertainty. The horizontal red dashed line marks the maximum physical distance between the central Lyα emitting source and its furthest companion.
Current usage metrics show cumulative count of Article Views (full-text article views including HTML views, PDF and ePub downloads, according to the available data) and Abstracts Views on Vision4Press platform.
Data correspond to usage on the plateform after 2015. The current usage metrics is available 48-96 hours after online publication and is updated daily on week days.
Initial download of the metrics may take a while.