Fig. 2.
Download original image
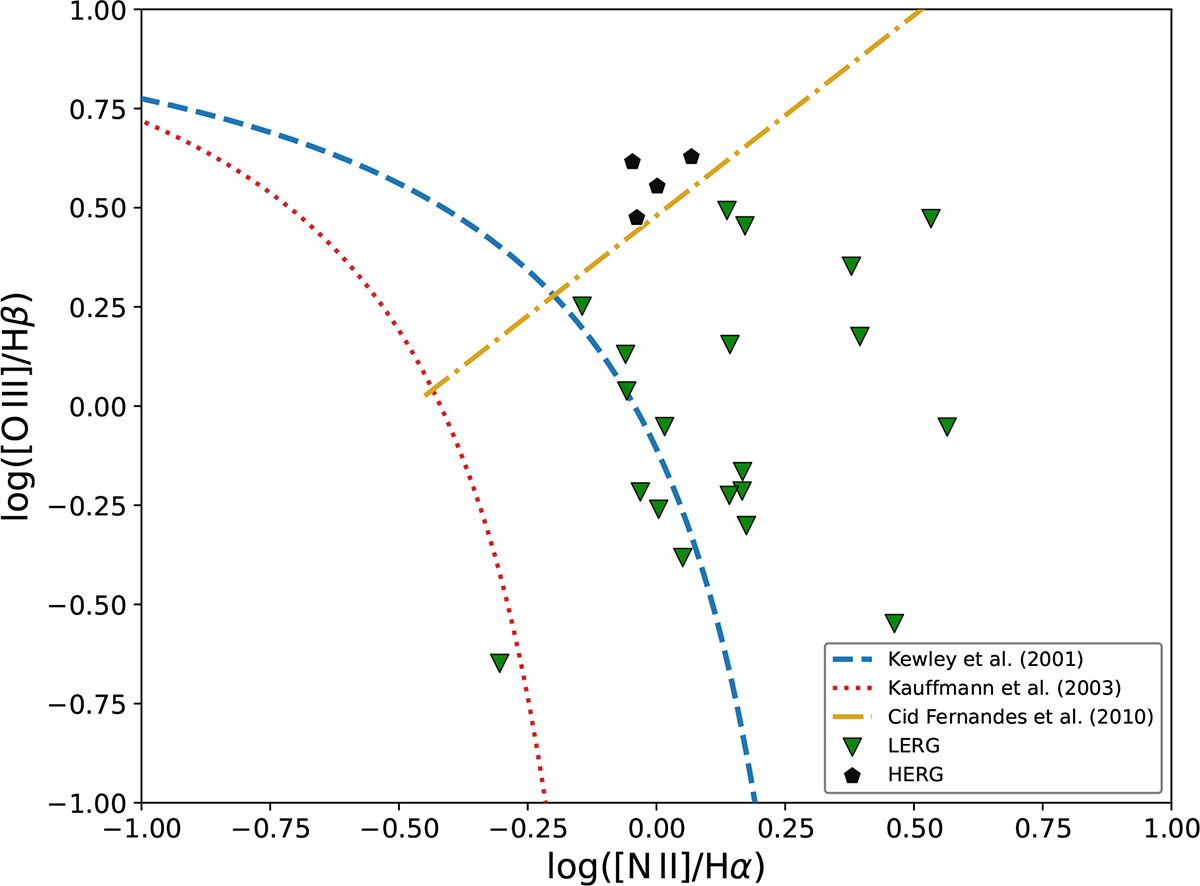
BPT diagnostic diagram showing the emission-line ratios log([N II]/Hα) versus log([O III]/Hβ) for the SDSS-selected sample. The demarcation curves from Kauffmann et al. (2003), Kewley et al. (2001), and Cid Fernandes et al. (2010) are shown to separate star-forming, composite, LERG, and HERG regimes. Sources located below the dash–dotted orange line are classified as LERGs (green triangles), while those above are classified as HERGs (black pentagons).
Current usage metrics show cumulative count of Article Views (full-text article views including HTML views, PDF and ePub downloads, according to the available data) and Abstracts Views on Vision4Press platform.
Data correspond to usage on the plateform after 2015. The current usage metrics is available 48-96 hours after online publication and is updated daily on week days.
Initial download of the metrics may take a while.