| Issue |
A&A
Volume 708, April 2026
|
|
|---|---|---|
| Article Number | A56 | |
| Number of page(s) | 12 | |
| Section | Extragalactic astronomy | |
| DOI | https://doi.org/10.1051/0004-6361/202556939 | |
| Published online | 26 March 2026 | |
Linking Fermi blazars and radio galaxies through accretion and jet radiation mechanisms
1
Dipartimento di Fisica e Astronomia “G. Galilei”, Universitá di Padova, Via F. Marzolo, 8, I-35131 Padova, Italy
2
Istituto Nazionale di Fisica Nucleare, Sezione di Padova, I-35131 Padova, Italy
3
Centre for Astrophysics, Guangzhou University, Guangzhou 510006, People’s Republic of China
4
INAF – Istituto di Radioastronomia, Via Gobetti 101, 40129 Bologna, Italy
5
Astronomy Science and Technology Research Laboratory of Department of Education of Guangdong Province, Guangzhou 510006, People’s Republic of China
6
Wuhu Vocational Technical University, School of Network Engineering, Anhui, People’s Republic of China
7
Institute of Astronomy and National Astronomical Observatory, Bulgarian Academy of Sciences, 72 Tsarigradsko shosse Blvd., 1784 Sofia, Bulgaria
★ Corresponding authors: This email address is being protected from spambots. You need JavaScript enabled to view it.
, This email address is being protected from spambots. You need JavaScript enabled to view it.
, This email address is being protected from spambots. You need JavaScript enabled to view it.
Received:
21
August
2025
Accepted:
10
February
2026
Abstract
Context. Based on the classical unification, blazars, namely BL Lacertae objects (BL Lacs) and flat-spectrum radio quasars (FSRQs), are believed to correspond to radio galaxies, when observed at small jet viewing angles.
Aims. In this paper, we aim to compile a sample of Fermi blazars [redshift, z ∈ (0.002 − 4.313)] and radio galaxies [z ∈ (0.001 − 1.048)] to provide new insights into a unified accretion and ejection scenario between aligned and misaligned radio-loud active galactic nuclei, by considering their optical emission-line classifications (low- and high-excitation radio galaxies, LERGs and HERGs, respectively), which are more representative of their accretion states.
Methods. We adopted the statistical analyses of accretion properties and high-energy beaming patterns for both Fermi blazars and radio galaxies to investigate a unified accretion–ejection scenario.
Results. In the γ-ray luminosity–photon index plane, HERGs populate the region of higher luminosities and softer photon indices, akin to FSRQs, whereas LERGs fill at lower luminosities with harder photon indices, analogous to BL Lacs. This parallel segregation indicates that LERGs and HERGs represent the misaligned counterparts of BL Lacs and FSRQs, respectively. The unified picture is further supported by the Compton dominance–photon index diagram, whereby FSRQs and HERGs dominated by external Compton (EC) emissions are distinctly separated from BL Lacs and LERGs governed by synchrotron self-Compton (SSC) emissions. Similarly, the diagram of accretion rate versus γ-ray photon index reveals two distinct accretion–ejection states: a low-accretion-rate branch (BL Lacs and LERGs) is associated with the SSC model, and a high-accretion-rate branch (FSRQs and HERGs) is linked to the EC model. These results strongly strengthen the idea of a unified accretion and ejection paradigm between blazars and radio galaxies separating into two distinct states.
Key words: radiation mechanisms: non-thermal / galaxies: active / BL Lacertae objects: general / galaxies: jets
© The Authors 2026
 Open Access article, published by EDP Sciences, under the terms of the Creative Commons Attribution License (https://creativecommons.org/licenses/by/4.0), which permits unrestricted use, distribution, and reproduction in any medium, provided the original work is properly cited.
This article is published in open access under the Subscribe to Open model. This email address is being protected from spambots. You need JavaScript enabled to view it. to support open access publication.
1. Introduction
Blazars are a special subclass of radio-loud active galactic nuclei (RLAGNs) that exhibit observational properties dominated by relativistic jets, such as rapid variabilities, high luminosities and polarisations, apparent superluminal motions, radio core-dominance morphologies, or energetic high-energy emissions (Wills et al. 1992; Vermeulen & Cohen 1994; Fan et al. 1996; Homan et al. 2021; Mooney et al. 2021; Fan et al. 2021; Abdollahi et al. 2022; Ajello et al. 2022; Liodakis et al. 2022; Xiao et al. 2022; Yuan et al. 2023; Agudo et al. 2025). They come in two flavours based on the equivalent widths (EWs) of their emission lines: flat-spectrum radio quasars (FSRQs) have EW > 5 Å, while BL Lacertae objects (BL Lacs) are defined by EW < 5 Å (Stickel et al. 1991).
Radio galaxies, also a subclass of RLAGNs, are categorised into Fanaroff-Riley type I (FR Is) and type II (FR IIs) radio galaxies by the radio power and the extended morphology (Fanaroff & Riley 1974). Recently, a very abundant class of nearby compact radio sources has been identified as FR type 0 (FR 0s) radio galaxies, which share similar core luminosities, but a factor of ∼100 − 1000 weaker jetted extended emission with respect to the FR Is (Ghisellini 2011; Baldi 2023). Radio galaxies (FR 0, FR I, FR II) are noted as misaligned AGNs because their relativistic jets are oriented away from the line of sight (Abdo et al. 2010c); when their jets align with observers, these radio galaxies are referred to as blazars (BL Lacs and FSRQs) in the classical unification paradigm (Ghisellini et al. 1993; Urry & Padovani 1995).
According to the emission-line properties, the population of radio galaxies can also be separated into low-excitation radio galaxies (LERGs) and high-excitation radio galaxies (HERGs; Best & Heckman 2012; Heckman & Best 2014), in which the former is associated with low accretion rates, typically λEdd < 0.01LEdd1, and the latter with high accretion rates, approximately λEdd ≈ (0.01 − 0.1)LEdd. The optical spectroscopic classes are more representative of the two accretion regimes onto the supermassive BHs than the multiple radio morphological classes (e.g. Buttiglione et al. 2010; Mingo et al. 2022; Grandi et al. 2025). In general, FR 0s and FR Is are low-power LERGs with the central engine dominated by radiatively inefficient, advective-dominated accretion flow (ADAF; Heckman & Best 2014; Capetti et al. 2017a; Baldi et al. 2018; Ye et al. 2025), but FR IIs are a heterogeneous population of high-power RLAGNs with both LERGs and HERGs (Tadhunter 2008; Buttiglione et al. 2010; Baldi et al. 2010; Capetti et al. 2017b; Hardcastle & Croston 2020; Mingo et al. 2022), with the latter powered by a radiatively efficient standard thin disc (Shakura & Sunyaev 1973).
The emission-line property serves not only as a classification criterion for both blazars and radio galaxies, but also as a reliable tracer for the accretion state, which is closely linked to the ejection mechanism (Ghisellini et al. 2011; Sbarrato et al. 2012; Ghisellini et al. 2014; Chen et al. 2015). Sbarrato et al. (2014) found a tight correlation between the accretion rate and jet power in blazars, highlighting a transition from radiatively efficient accretion (e.g. FSRQs) to inefficient accretion (e.g. BL Lacs), each following distinct relations with their jet powers. Similar to the blazar case, the spectroscopy-based classification of the LERGs and HERGs also reflects a switch of the accretion regime and the jet power (Ghisellini & Celotti 2001; Hardcastle & Croston 2020; Boccardi et al. 2021; Torresi et al. 2022; Grandi et al. 2025).
The strong contributions of the relativistic jets to the spectral energy distributions (SEDs) shape a characteristic double-hump structure, either in blazars or in radio galaxies (Fossati et al. 1998; Capetti et al. 2002b; Ghisellini et al. 2010; Fan et al. 2016; Cerruti 2020; Yang et al. 2022a; Ulgiati et al. 2025). In the leptonic model, the first hump of SEDs is attributed to the synchrotron radiation, from radio to soft X-ray bands (Finke et al. 2008), while the second hump arises from the inverse Compton (IC) radiation: either synchrotron self-Compton (SSC) or external Compton (EC) mechanisms due to different seed photon originations (Dermer & Schlickeiser 1993; Sikora et al. 1994; Błażejowski et al. 2000; Cerruti 2020). In the SSC model, synchrotron photons, produced within the jet as seed photons, are up-scattered by high-energy electrons, which is adopted to explain the γ-ray spectra of BL Lacs (Ghisellini et al. 2010; Zhao et al. 2024; Lian et al. 2025). In contrast, if the seed photons originate outside the jet, such as the broad-line region, dusty torus, accretion disc, or cosmic microwave background (CMB; Dermer & Schlickeiser 1993; Sikora et al. 1994; Błażejowski et al. 2000; Fan et al. 2023), these external photons interacting with high-energy electrons in the jet, as the EC process, explain the γ-ray spectra in FSRQs (Ghisellini & Tavecchio 2009; Chen 2018; Cerruti 2020). According to Dermer (1995), the beaming patterns are different between the SSC and EC models: the SSC emissions go with the Doppler factors2(δ) in the observer frame as fSSC ∼ δγ3 + αγ, and the EC emissions go as fEC ∼ δγ4 + 2αγ. Here, αγ is a γ-ray spectral index (fν ∝ ν−αγ). Therefore, the ratio of the beaming patterns between the EC and SSC models is fEC/fSSC ∝ δγ1 + αγ. The different high-energy beaming patterns between SSC and EC models help one to constrain the radiation models of the γ-ray sources (Dermer 1995; Huang et al. 1999; Fan et al. 2013).
Thanks to the Fermi Large Area Telescope (Fermi/LAT), one can observe a sample of thousands of blazars (e.g. Ajello et al. 2022) and study the high-energy leptonic or hadronic models. However, the hadronic model for blazars is argued to be ruled out with the evidence of the high optical to the X-ray polarisation ratio (Agudo et al. 2025). The hadronic processes for a single emission region and/or multiple emission regions expect the polarisations in the X-ray band to be comparable to those in the optical band (Zhang et al. 2024). Therefore, the low polarisation from the X-ray, compared to the optical band, favours a leptonic scenario in which the low-energy photons are up-scattered to the X-ray band in BL Lacs. In addition, the multi-wavelength polarisations for BL Lacs also support the view that the IC scattering from the electrons dominates at the X-ray energies, regardless of the jet compositions and emission models (Liodakis et al. 2025). These phenomena suggest that the leptonic jet model is a prominent scenario in blazars’ γ-ray sky.
From the 4 yrs of Fermi observations, Ghisellini et al. (2017) analysed a sample of 747 blazars and showed that the observed γ-ray luminosities span a broad range from 1042 to 1050 erg s−1. BL Lacs are typically found at lower redshifts (z ≲ 1) and exhibit lower average luminosities with a harder γ-ray photon index (Γγ = αγ + 1), while FSRQs are located at intermediate to high redshifts and display higher average luminosities with a softer γ-ray photon index. A Fermi blazar sequence is proposed from a BL Lac population with the lower IC luminosity and the higher IC peak frequency extending to an FSRQ population with the higher IC luminosity and lower IC peak frequency. This phenomenon is explained by the different beaming patterns between the SSC and EC models (Fossati et al. 1998; Ghisellini et al. 2017; Boula et al. 2026).
Besides the Fermi blazars, radio galaxies also appear in the γ-ray sky (Abdo et al. 2010c; Ajello et al. 2022), and a comparable number between γ-ray FR Is and FR IIs is found in Paliya et al. (2024) and Paliya et al. (2025). However, even though FR 0 is the dominant population of the local Universe, only a few have been detected or proposed as candidates by Fermi/LAT (Grandi et al. 2016; Baldi et al. 2019b; Paliya 2021; Pannikkote et al. 2023). Instead of the radio morphology and radio power, an accretion-ejection scenario seems to be more physically relevant to link radio galaxies and blazars: LERGs are suggested to be potential parent populations of the BL Lacs (Laing et al. 1994; Giommi et al. 2012; Chen et al. 2015; Mooney et al. 2021), in which FR 0 LERGs are highly connected to the nearby high-synchrotron peaked BL Lacs, sharing the similarities of the accretion disc, jet formation mechanisms, and clusters of the environments, (Massaro et al. 2020; Ye et al. 2025). HERGs (mostly FR IIs) exhibit a luminous accretion disc and a powerful jet, similar to the FSRQs (Meyer et al. 2011; Best & Heckman 2012; Chen et al. 2015; Keenan et al. 2021). Suppose that the distinct beaming patterns (SSC and EC models) help distinguish Fermi BL Lacs from FSRQs. In that case, the same principle may also apply to separate Fermi LERGs from HERGs, offering new insights into the Fermi blazar–radio galaxy connection. This motivates the present paper, where we compiled a sample of Fermi blazars and radio galaxies to discuss the high-energy leptonic models (SSC or EC), and proposed arguments in favour of a unified scenario between blazars and radio galaxies. Throughout the whole paper, a Λ cold dark matter cosmology, ΩΛ ∼ 0.7, ΩM ∼ 0.3, and H0 = 70 km s−1 Mpc−1, is considered.
2. Samples
2.1. Blazars
In this paper, we considered the BL Lacs and FSRQs using the fourth catalogue of AGNs detected by the Fermi/LAT (4LAC) based on 12 years of data (Data Release 3; 4LAC-DR3), which includes 1667 blazars with available redshifts (Ajello et al. 2022). Four of the 1667 blazars (4FGL J0601.3-7238, 4FGL J0654.0-4152, 4FGL J0719.7-4012, and 4FGL J0828.3+4152) show extremely low γ-ray luminosities (log Lγ < 40 erg/s) and could be misclassified as blazars. Therefore, these four sources were discarded. Meanwhile, 41 of 1663 blazars were cross-checked with the radio morphology, radio core dominance, and radio spectral index; these blazars were re-classified as Fermi radio galaxies in Paliya et al. (2024) and Paliya et al. (2025). Therefore, the final blazar sample is 1622 sources, with 838 BL Lacs and 784 FSRQs.
The redshift distribution of BL Lacs spans 0.002 ≤ z ≤ 3.528 with an average value of ⟨zB⟩ = 0.43 ± 0.01, whereas FSRQs range from z = 0.029 to z = 4.313 with a higher average redshift of ⟨zF⟩ = 1.20 ± 0.02. The γ-ray luminosities of 1622 blazars were computed using the integrated photon flux in the 1–100 GeV band, following the procedure described in Yang et al. (2022b) and Xiao et al. (2022). The average γ-ray luminosity of FSRQs (log Lγ = 46.09 ± 0.03 erg/s) is significantly higher than that of BL Lacs (log Lγ = 44.92 ± 0.03 erg/s). The two populations exhibit statistically significant differences in both luminosity and photon-index distributions, as confirmed by Kolmogorov–Smirnov (K–S) tests with p < 10−4 for each parameter.
Ghisellini et al. (2011) investigated the relation between the γ-ray spectral index and γ-ray luminosity (Γγ–Lγ) and argued that the different loci of BL Lacs and FSRQs in this plane reflect differences in jet power, ambient environment, and dominant high-energy emission mechanisms (Ghisellini & Tavecchio 2009; Ghisellini et al. 2011; Sbarrato et al. 2012, 2014; Ghisellini et al. 2017). Our Γγ–Lγ diagram (Fig. 1) for the enlarged blazar sample exhibits a similar distribution to that reported by Ghisellini et al. (2011), further reinforcing the separation between FSRQs and BL Lacs that arises from their different accretion regimes and high-energy radiation mechanisms (Sbarrato et al. 2012; Paliya et al. 2021).
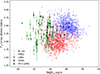 |
Fig. 1. Relation between the γ-ray luminosities (Lγ) and γ-ray photon indices (Γγ). The green triangle is for LERGs, the green square is for FR 0 LERGs, and the black pentagram is for HERGs. BL Lacs are in red diamonds, while FSRQs are in blue circles. |
2.2. Radio galaxies
The classical classification of radio galaxies (FR I or FR II) is based on their jet extended morphology, which was found to be related to the radio power (Fanaroff & Riley 1974). However, this observational radio dichotomy may hide the physical nature of their central engines among the subclasses of radio galaxies (Hardcastle et al. 2007). The LERGs and HERGs are separated by the emission-line properties, as indicated by the accretion-ejection paradigm (Heckman & Best 2014). The accretion-ejection diagram between LERGs and HERGs is a more physical classification criterion for radio galaxies, and the differences are explained by the changes in the accretion rate from inefficient to efficient discs (Ghisellini & Celotti 2001; Hardcastle et al. 2007; Buttiglione et al. 2010; Best & Heckman 2012; Heckman & Best 2014; Mingo et al. 2022).
From the 14 years of observations of the fourth Fermi catalogue (4FGL-DR4), 53 γ-ray radio galaxies have been reported (Abdollahi et al. 2022). Recently, Paliya et al. (2024) and Paliya et al. (2025) systematically examined the radio morphologies of γ-ray AGNs and applied three diagnostic criteria to identify misaligned γ-ray radio galaxies: (i) optical spectra dominated by narrow emission lines and/or galaxy spectral features, (ii) low radio core dominance (R < 1), and (iii) steep radio spectra (αr > 0.5). Using these diagnostics, they identified 113 additional Fermi radio galaxies that satisfy at least two of the three criteria, bringing the total number of Fermi radio galaxies to 166.
We first cross-matched these 166 sources with the literature and identified 23 radio galaxies with optical classifications as LERGs or HERGs3 based on the BPT (Baldwin–Phillips–Terlevich) diagram (e.g. Buttiglione et al. 2010). The classifications are listed in Col. (6) with the reference in Col. (7) in Table A.1.
We then cross-checked the Sloan Digital Sky Survey (SDSS4) for optical spectra for the remaining sources and identified 24 objects with sufficient emission-line information to be classified using the BPT diagram, following the procedure of Chilufya et al. (2025). Figure 2 shows the distribution of the SDSS subsample in the BPT diagram, with the delimitation curves from Kauffmann et al. (2003), Kewley et al. (2001), and Cid Fernandes et al. (2010) separating the star-forming, composite, LERG, and HERG regimes. Among the SDSS sources with measured [N II]/Hα and [O III]/Hβ ratios, 20 lie below the dash–dotted orange line and are classified as LERGs (green triangles), while four fall above the boundary and are classified as HERGs (black pentagons). In total, the BPT analysis yields 36 LERGs and 11 HERGs.
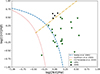 |
Fig. 2. BPT diagnostic diagram showing the emission-line ratios log([N II]/Hα) versus log([O III]/Hβ) for the SDSS-selected sample. The demarcation curves from Kauffmann et al. (2003), Kewley et al. (2001), and Cid Fernandes et al. (2010) are shown to separate star-forming, composite, LERG, and HERG regimes. Sources located below the dash–dotted orange line are classified as LERGs (green triangles), while those above are classified as HERGs (black pentagons). |
For unclassified radio galaxies, we assigned tentative classifications based on partial spectral information. Sources exhibiting prominent broad emission lines (e.g. 3C 120) are classified as HERGs, whereas those displaying very weak or absent emission lines, consistent with typical LERG spectra in Buttiglione et al. (2010), are classified as LERGs. In total, 18 radio galaxies were classified in this case, yielding 12 LERGs and 6 HERGs, as is shown in Table A.2.
Fermi observations have also established the presence of γ-ray FR 0s. The first source, Tol 1326−379, was identified by Grandi et al. (2016) and subsequently examined by Fu et al. (2022). Stacking analyses by Paliya (2021) revealed three additional FR 0 candidates, and Pannikkote et al. (2023) expanded this number to seven, all classified as LERGs based on the BPT diagram (Grandi et al. 2016; Pannikkote et al. 2023). Since LEDA 55267 is already included in Fermi catalogue, we incorporated the seven FR 0 LERGs (Col. 6 in Table A.1) to further enlarge our Fermi radio galaxy sample.
In summary, our final Fermi radio galaxy sample comprises 55 LERGs and 17 HERGs. The LERGs span a redshift range of 0.001 ≤ z ≤ 0.681 with an average value of ⟨zL⟩ = 0.11 ± 0.02, while the HERGs span 0.028 ≤ z ≤ 1.048 with an average value of ⟨zH⟩ = 0.23 ± 0.07.
In the Γγ–Lγ plane (Fig. 1), LERGs tend to occupy the region of lower γ-ray luminosities (⟨log Lγ⟩ = 43.13 ± 0.14 erg/s) and flatter photon indices (⟨Γγ⟩ = 2.19 ± 0.04), whereas HERGs cluster at higher γ-ray luminosities (⟨log Lγ⟩ = 43.93 ± 0.25 erg/s) with steeper photon indices (⟨Γγ⟩ = 2.46 ± 0.06). Overall, LERGs and HERGs populate distinct regions in Γγ − Lγ diagram, similar to the case of blazars (Ghisellini et al. 2011), supporting a unified scenario in which BL Lacs correspond to the LERG population and FSRQs align with HERGs.
3. Discussion
The physical processes underlying the γ-ray emission in RLAGNs are not firmly established; however, it is commonly assumed that misaligned AGNs experience the same emission processes as their beamed counterparts (e.g. blazars; Abdo et al. 2010c; Grandi 2012; Angioni et al. 2017). The relation between the γ-ray luminosities and the radio-core luminosities was presented in Ghisellini et al. (2005) for three EGRET5γ-ray FR Is (Cen A, NGC 6251, and M 87), which was later confirmed by Grandi (2012) with a sample of 11 Fermi misaligned RLAGNs (8 FR Is and 3 FR IIs). A similar result was also presented in Di Mauro et al. (2014) for 12 Fermi radio galaxies (8 FR Is and 4 FR IIs) and also FR 0s (Khatiya et al. 2024), and they found that the slope coefficient of the correlation for radio galaxies is similar to the correlation for blazars. This might indicate that the γ-ray emission mechanism is similar between radio galaxies and blazars.
However, one must also remember redshift as a significant observational bias. The HERGs (⟨zH⟩ = 0.23) have a higher average redshift than the LERGs (⟨zL⟩ = 0.11). The FSRQs are generally observed at higher redshifts (⟨zF⟩ = 1.20), while BL Lacs are typically found at lower redshifts (⟨zB⟩ = 0.43). Unfortunately, the definition of BL Lacs (EW < 5 Å; Stickel et al. 1991) prevents one from getting spectroscopic redshift measurements for BL Lacs if the jet continuum is boosted and significantly dominates the emission-line width (Foschini 2012; Chen et al. 2025). Therefore, an observational bias of redshift could artificially produce the positive tendency from BL Lacs (LERGs) to FSRQs (HERGs) in the plot of Γγ–Lγ, and obscure the true physical origin of the separation. To mitigate the redshift bias, we adopted the Compton dominance (CD) parameter, defined as the ratio of the flux densities of the IC to the synchrotron peak emission, and other statistical tests to explore the redshift dependence.
3.1. Compton dominances and unifications
The CD is essentially a redshift-independent quantity, defined as the ratio of the IC peak luminosity (LIC) to the synchrotron peak luminosity (Lsyn) or the ratio of the IC peak flux (fIC) to the synchrotron peak flux (fsyn), CD = νICLIC/νsynLsyn = νICfIC/νsynfsyn. The CD is a high-energy to low-energy emission ratio, reducing the redshift dependence (Abdo et al. 2010a; Paliya et al. 2021).
We compiled CD values for Fermi blazars and radio galaxies from Paliya et al. (2021) and Chen et al. (2023). In total, CD values were obtained for 882 blazars and 48 radio galaxies. The resulting CD distributions are shown in Fig. 3. A K–S test comparing the CD distributions of 324 BL Lacs and 558 FSRQs yields a probability of p < 10−4, indicating that the two populations are statistically distinct. As is discussed in Paliya et al. (2021), FSRQs typically exhibit higher CD values and are thus more strongly Compton-dominated, whereas BL Lacs tend to have lower CD values, reflecting a weaker Compton component. The dividing line at CD = 1 corresponds to the transition where the high-energy peak becomes dominant over the synchrotron peak, marking a shift in the underlying leptonic emission mechanism from SSC–dominated to EC-dominated scenarios.
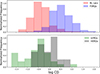 |
Fig. 3. Distribution of the CDs for blazars (upper panel) and radio galaxies (lower panel). Both of them scale into the same bin. |
For SSC-dominated sources, the SSC emission is related to γ-ray Doppler factors as fSSC ∼ δγ3 + αγ, and the synchrotron emission is related to the radio Doppler factors, fsyn ∼ δr3 + αr. The radio spectral index for blazars is flat with the assumption of αr ∼ 0 (Capetti et al. 2002a; Abdo et al. 2010a; Fan et al. 2016), and the γ-ray Doppler factors from Zhang et al. (2002), Zhang et al. (2020), and Chen et al. (2024) are in the similar ranges and averages to the variability Doppler factors from the long-term radio observations (Liodakis et al. 2018); namely, δγ ≈ δr. Therefore, the CD for the SSC-dominated sources may serve as
 (1)
(1)
However, for EC-dominated sources, the CD goes with the γ-ray spectral index as
 (2)
(2)
Therefore, in the plot of the γ-ray spectral index and the CD (Γγ−CD), we would expect a broken slope changing from SSC-dominated sources (e.g. BL Lacs) to EC-dominated ones (e.g. FSRQs). The expected broken slope between BL Lacs and FSRQs is confirmed in Fig. 4. When a linear regression in the Γγ−CD diagram is considered between BL Lacs and FSRQs, we obtained
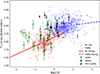 |
Fig. 4. Relation between the CD and the γ-ray photon indices (Γγ). The labels are the same as Fig. 1. The solid red line is the linear regression for BL Lacs [Γγ = (0.27 ± 0.03) logCD + (2.13 ± 0.02)], and the dashed blue line is the linear regression for FSRQs [Γγ = (0.08 ± 0.02) logCD + (2.43 ± 0.01)]. |
where a correlation coefficient of 0.44 and a probability of p < 10−4 for BL Lacs, and a correlation coefficient of 0.21 and a probability of p < 10−4 for FSRQs. The corresponding linear regressions for both BL Lacs (solid red line) and FSRQs (dashed blue line) are shown in Fig. 4.
As can be seen in the lower panel of Fig. 3, a potential bimodality also appears, with 35 LERGs having an average ⟨logCDL⟩= − 0.03 ± 0.11, but 13 HERGs having a higher average of ⟨logCDH⟩ = 0.15 ± 0.13, supporting that an EC mechanism starts dominating in HERGs. The K-S test reveals differences in CD between 35 LERGs and 13 HERGs with p = 0.05. A potential bimodality of CD between LERGs and HERGs is similar to blazars between BL Lacs and FSRQs (Paliya et al. 2021).
In the plot of Γγ−CD, we could find that LERGs are located with the BL Lacs, with the smaller CD and harder spectral index, while HERGs are together with the FSRQs, sharing the higher CD and softer spectral index These results invoke common signatures of jet radiation mechanisms between the two classes of blazars and radio galaxies, in which BL Lacs reconcile with LERGs with the SSC-dominated radiation, whereas FSRQs reconcile with HERGs with the EC-dominated process. In summary, the Γγ–CD plane is able to simultaneously distinguish BL Lacs from FSRQs, as well as LERGs from HERGs, strengthening the connection between the two classes of blazars and radio galaxies through common accretion-ejection physics.
3.2. Accretion and ejection
The dichotomy observed in the Γγ − Lγ plane (Fig. 1) emerges for both blazars and their misaligned counterparts. On average, HERGs exhibit higher γ-ray luminosities and softer photon indices than LERGs. In HERGs, the external low-energy seed photons from the broad line region, the torus, and the radiatively efficient disc (present in HERGs and not in LERGs, Tadhunter 2008; Heckman & Best 2014) are efficiently up-scattered by relativistic jets, leading to the higher γ-ray luminosities with softer γ-ray spectra due to the faster energy losses of the relativistic electrons. In contrast, the SSC process in LERGs relies on seed photons originating from the internal synchrotron emission of the jets, producing the lower γ-ray luminosities with the harder γ-ray spectra observed by Fermi. This result supports a unified picture: the γ-ray emissions of both BL Lacs and LERGs are powered by SSC, while those of FSRQs and HERGs are dominated by EC.
While this framework primarily applies to γ-ray emission produced in the inner jet regions, additional contributions from external seed photons on larger spatial scales may also be relevant in some sources. A notable example is the nearby radio galaxy Centaurus A, for which extended γ-ray emission has been detected from its radio lobes (Abdo et al. 2010b). In this case, the lobe component accounts for more than half of the total γ-ray output and is commonly interpreted as IC scattering of CMB photons. This indicates that, in Fermi radio galaxies with significant extended emission, the observed γ-ray luminosity may not be directly linked to the central engine or to the accretion disc properties.
Furthermore, Paliya et al. (2021) recently proposed that the CD can be considered as a powerful parameter to reveal the physics of the central engine in beamed AGNs: the low-accretion-rate sources have lower CD, and high-accretion-rate sources exhibit larger CD. This positive tendency has since been discussed and supported by a large Fermi sample including Fermi blazars, narrow-line Seyfert galaxies, and radio galaxies (Chen et al. 2023). These results strengthen the argument that CD can be considered a good proxy for the accretion rate in RLAGNs. For further support of the accretion rate differences, we also collected the bolometric (thermal) luminosities and the BH masses from Paliya et al. (2021), in which they compiled a sample of Fermi blazars with the spectroscopic information from SDSS, and obtained the bolometric luminosities from the broad emission-line luminosities with the assumption, LBLR = 0.1Lbol (Ghisellini et al. 2014). However, for BL Lacs with featureless emission spectra, the bolometric luminosities were estimated from the 3σ upper limits of the total emission-line luminosity (Paliya et al. 2021). With the goal of deriving the accretion rate (Lbol/LEdd), we collected the BH masses and bolometric luminosities for both BL Lacs and FSRQs from Paliya et al. (2021) and Chen et al. (2023). The accretion-rate distributions of 320 BL Lacs and 564 FSRQs (Fig. 5) differ significantly, as confirmed by a K–S test with the probability of p < 10−4.
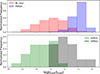 |
Fig. 5. Distribution of the accretion rates (Lbol/LEdd) for blazars (upper panel) and radio galaxies (lower panel). Both of them scale into the same bin. |
The accretion rate, Lbol/LEdd (i.e. Eddington ratio), for radio galaxies is derived from the bolometric (thermal) emission, estimated from the isotropic [O III] (λ5007 Å) emission line luminosity from the narrow line region, Lbol = 3500L[O III] (Heckman et al. 2004; Heckman & Best 2014). If the [O III] emission lines were not available from the literature or SDSS, we considered the Chandra 2–7 keV X-ray luminosity (Evans et al. 2010) as an indicator of the bolometric luminosity (Lusso et al. 2012; López et al. 2024). We adopted the relation, Lbol = 9.588LX, for LERGs (López et al. 2024), or computed the bolometric luminosity for BLRGs (Type-I) or HERGs (Type-II) from the cubic functions between the bolometric and 2–10 keV X-ray luminosities of Lusso et al. (2012).
If the stellar velocity dispersions from the SDSS and/or HyperLeda website (http://atlas.obs-hp.fr/hyperleda, Makarov et al. 2014) were available, then the BH masses were computed from the relation between the BH masses and velocity dispersion Tremaine et al. (2002, labelled S-T02 or M14-T02 in Tables A.1 and A.2); otherwise, the BH masses were obtained from the literature. The γ-ray properties, bolometric luminosities, and BH masses for those 7 FR 0 LERGs were directly collected from the Grandi et al. (2016), Baldi et al. (2018), and Pannikkote et al. (2023).
Finally, we obtained a sample of 61 radio galaxies (49 LERGs, 12 HERGs) with available accretion rates, as presented in Tables A.1 and A.2. A double peak of log(Lbol/LEdd) between LERGs and HERGs is also shown in the lower panel of Fig. 5. The Eddington ratio for LERGs ranges from log(Lbol/LEdd) = − 5.75 to log(Lbol/LEdd) = − 1.88, with an average of −3.57 ± 0.12, while for HERGs, it ranges from log(Lbol/LEdd) = − 2.94 to log(Lbol/LEdd) = 0.19, with an average of −1.79 ± 0.26.
A K-S test probability for the Eddington ratio between 49 LERGs and 12 HERGs is p < 10−4, supporting the idea that their accretion rates are significantly different, as has also been reported in other studies (e.g. Best & Heckman 2012; Grandi et al. 2021; Chilufya et al. 2025; Arnaudova et al. 2025). This bimodality not only implies a switch of the disc from inefficient to efficient, but also a switch towards a unified accretion scenario between radio galaxies and blazars: a low efficient disc (e.g. ADAF; Heckman & Best 2014; Torresi et al. 2022; Ye et al. 2025) in both LERGs and BL Lacs, and a high efficient standard disc in both HERGs and FSRQs.
The symbiotic relationship between accretion and ejection in blazar and radio galaxies is strongly supported by population studies (Ghisellini & Celotti 2001; Abdo et al. 2010c; Xie & Zhang 2012; Sbarrato et al. 2012, 2014; Ghisellini et al. 2014; Chen et al. 2015; Paliya et al. 2021). The relation between the bolometric luminosities (indicator for accretion) and the γ-ray luminosities (indicator for jet) is plotted in Fig. 6. The strong correlation between them is evident for both blazars and radio galaxies, as shown in the upper panel of Fig. 6. Whereas for HERGs the statistics are limited by the small number of objects, these tight relationships persist for BL Lacs, FSRQs, and LERGs even after applying the Spearman partial rank correlation6, which considers the effect of redshift (see Table 2), with a probability of p < 10−4. In addition, we can note that LERGs and BL Lacs show parallel relations, with the latter, of course, γ-ray-louder. These results further support the existence of accretion–jet symbiosis in RLAGNs.
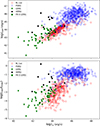 |
Fig. 6. Relation between the γ-ray luminosities, Lγ, and the bolometric luminosities, Lbol (upper panel), or the accretion rate, Lbol/LEdd (lower panel), for blazars and radio galaxies. The labels are the same as Fig. 1. |
Parameters for Fermi blazars (extract).
In the lower panel of Fig. 6, we presented the relation between γ-ray luminosity and the accretion rate [log(Lbol/LEdd)] for RLAGNs. Notably, the slope changes significantly from BL Lacs to FSRQs, implying the presence of two distinct central engines separated at log(Lbol/LEdd)∼ − 2 (also evident in Fig. 5), which is the standard separation from (quasar-like) radiatively efficient and (ADAF-type) radiatively inefficient disc physics (Ghisellini et al. 2011; Heckman & Best 2014). Interestingly, for BL Lacs, γ-ray luminosity increases with the Eddington ratio, whereas in FSRQs the relation between the accretion rate and γ-ray luminosity becomes nearly flat above log(Lbol/LEdd) > − 2. However, the contribution of Doppler boosting to the γ-ray luminosities and the dependence on the jet orientation and bulk velocity make this diagram difficult to interpret in relation to two accretion and ejection states. Further studies on jet and high-energy emission for RLAGNs could shed new light on the physical segregation of different classes noted in Fig. 6.
In comparison, Fermi radio galaxies, with accretion rates comparable to those of blazars, exhibit systematically lower γ-ray luminosities, forming a roughly parallel correlation. Assuming a linear relation between the bolometric luminosity (or accretion rate) and the γ-ray luminosity (Ghisellini et al. 2014), i.e. log Lbol = alog Lγob + b, and adopting log Lγob = log Lγin + plog δ when the observed γ-ray emission is Doppler-boosted for blazars, we obtain log Lbol = a × log Lγin + [b + (a * p)log δ], where a, b, and p are the slope, intercept, and the different jet models7, respectively. Since the bolometric luminosity (and hence accretion rate, because it is derived from the emission lines) is an isotropic quantity for both radio galaxies and blazars, the slopes of the two populations are expected to be similar. The parallel relations observed in Fig. 6 support a unified accretion–ejection scenario, at least for LERGs and BL Lacs. Owing to the limited HERG sample, no FSRQ-like trend is identifiable among the HERGs.
This observed bimodality in the accretion and ejection is also clearly reflected in the Γγ–Lbol/LEdd plane (Fig. 7), where a noticeable change in slope is observed from BL Lacs to FSRQs. This pronounced transition strongly supports the shift between SSC- and EC-dominated emission mechanisms. At low accretion rates (log(Lbol/LEdd) < − 2), the γ-ray spectral index remains more or less flat for BL lacs. However, as the accretion rate becomes higher (log(Lbol/LEdd) > − 2) to form a standard disc, the spectral index becomes significantly softer for FSRQs. Within a high-radiative disc environment, the presence of abundant external seed photons in the broad line region or dusty torus, stimulated by the central accretion disc, effectively cools the relativistic electrons, leading to a rapid steepening of the γ-ray spectrum. This provides clear evidence of the accretion–ejection connection and the existence of distinct beaming patterns between BL Lacs and FSRQs. Both the CD and broad emission-line luminosities are anti-correlated with the synchrotron peak frequency, showing a sequence from FSRQs to BL Lacs (Paliya et al. 2021; Chen et al. 2024). These results suggest that the Compton cooling effects are an explanation for the blazar sequence and also strongly support the accretion-ejection scenario between BL Lacs and FSRQs.
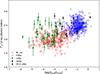 |
Fig. 7. Relation between the accretion rates (Lbol/LEdd) and γ-ray photon indices (Γγ). The labels are the same as Fig. 1. |
To further test whether the observed differences in blazars could be affected by redshift-related selection bias, we repeated the analysis using redshift-matched blazar subsamples (z ≤ 1.048), comparable to the redshift range of the Fermi radio galaxy sample. The statistical results remain consistent with those obtained from the full samples. The K–S tests were performed on the distributions of the γ-ray luminosity, γ-ray photon index, CD, and the accretion rate, and we found that all comparisons yield p < 0.05, indicating that BL Lacs and FSRQs are significantly different in these properties. Specifically, BL Lacs continue to populate the low-luminosity (⟨log Lγ⟩ = 44.78 ± 0.03 erg/s), low spectral-index (⟨Γγ⟩ = 2.00 ± 0.01), low Compton-dominance (⟨logCD⟩= − 0.43 ± 0.02), and low-accretion-rate (⟨log Lbol/LEdd⟩= − 2.97 ± 0.06) regime, whereas FSRQs are associated with higher luminosities (⟨log Lγ⟩ = 45.53 ± 0.05 erg/s), steeper spectral indices (⟨Γγ⟩ = 2.43 ± 0.01), higher CDs (⟨logCD⟩ = 0.37 ± 0.03), and higher accretion rates (⟨log Lbol/LEdd⟩= − 1.08 ± 0.03). These results confirmed that the trends discussed above are not driven by redshift differences, but instead reflect intrinsic physical distinctions between BL Lacs and FSRQs, in agreement with the full-sample analysis. In summary, the accretion rate and γ-ray properties separate well the SSC-dominated low accretors (LERGs and BL Lacs) from the EC-dominated high accretors (HERGs and FSRQs), which supports the scenario of a possible common accretion-ejection scenario between blazars and radio galaxies.
4. Conclusions
We compiled a sample of Fermi blazars and radio galaxies with the γ-ray luminosities, γ-ray spectral indices, CD, and accretion rates to discuss their radiation mechanisms and potential unification between blazars and radio galaxies. Here are the conclusions:
-
The distinct regions occupied by BL Lacs and FSRQs in the Γγ–Lγ plane can be attributed to different beaming patterns associated with SSC and EC mechanisms. We also found a similar tendency from LERGs to HERGs, suggesting common high-energy mechanisms between BL Lacs-LERGs (SSC) and FSRQs-HERGs (EC).
-
We analysed the different beaming patterns with the CD, and predicted a slope change from SSC-dominated sources [logCD ∝ (log δγ)⋅αγ] to EC-dominated ones [logCD ∝ (2log δγ)⋅αγ)]. This phenomenon is confirmed by a sample of 882 blazars. A significant change in the Γγ-CD diagram is presented between BL Lacs and FSRQs, in which LERGs and HERGs are also located in a similar area as blazar distributions, better reinforcing the beaming pattern (SSC and EC) models for BL Lacs-LERGs and FSRQs-HERGs.
-
A clear transition from BL Lacs to FSRQs is observed in the Γγ–Lbol/LEdd plane, which clearly provides compelling evidence for the accretion–ejection dichotomy between BL Lacs and FSRQs. Furthermore, the clear differences in blazars also successfully distinguish between LERGs and HERGs, suggesting the existence of two accretion-ejection modes for BL Lacs-LERGs and FSRQs-HERGs. We also note that the FR 0s are consistent with the LERG population in general (Baldi & Capetti 2010; Baldi et al. 2019a).
All these results represent evidence that BL Lacs-LERGs and FSRQs-HERGs correspond to two different accretion-ejection mechanisms, regardless of the extended radio morphology, which is consistent with earlier studies (Laing et al. 1994; Xu et al. 2009; Giommi et al. 2012). In radiatively efficient systems, such as FSRQs and HERGs (generally FR IIs), the accretion disc is capable of illuminating the broad- and narrow-line regions, and the dusty torus, creating a photon-rich environment around the relativistic jet. This abundance of external photons leads to efficient cooling of relativistic electrons, preventing them from reaching very high energies. As a result, the high-energy spectral peak occurs at lower frequencies and exhibits a steeper slope in Fermiγ-ray observations. Conversely, in radiatively inefficient accretion systems, such as BL Lacs and LERGs (FR 0s, FR Is, FR IIs), the surrounding nuclear environments remain similar but photon-poor (Capetti et al. 2005). The scarcity of seed photons allows jet electrons to attain higher energies, and phenomenalizes a high-frequency peak and a flatter γ-ray spectrum. Further multi-band studies on statistically complete samples of aligned and misaligned radio galaxies are needed to test the robustness of a unification scheme between FSRQs-HERGs and BL Lacs-LERGs.
Data availability
Table 1 is available at the CDS via https://cdsarc.cds.unistra.fr/viz-bin/cat/J/A+A/708/A56.
Acknowledgments
We greatly appreciate the referee’s support and insightful comments, which have helped us improve the manuscript. We would also like to appreciate the comments and ideas from E. Torresi, and the discussion with A. Capetti and F. Tavecchio. The work is partially supported by the National Natural Science Foundation of China (NSFC 12433004, U2031201), the Eighteenth Regular Meeting Exchange Project of the Scientific and Technological Cooperation Committee between the People’s Republic of China and the Republic of Bulgaria (Series No. 1802). JHF also acknowledges the science research grants from the China Manned Space Project with NO. CMS-CSST-2025-A07, and the support for Astrophysics Key Subjects of Guangdong Province. RDB acknowledges financial support from INAF mini-grant “FR0 radio galaxies” (Bando Ricerca Fondamentale INAF 2022). This research was also partially supported by the Bulgarian National Science Fund of the Ministry of Education and Science under grants KP-06-H68/4 (2022), KP-06-H88/4 (2024), and KP-06-KITAJ/12 (2024). This research has made use of SDSS-III, which has been provided by the Alfred P. Sloan Foundation, the Participating Institutions, the National Science Foundation, and the U.S. Department of Energy Office of Science. This research has made use of the NASA/IPAC Extragalactic Database (NED), which is operated by the Jet Propulsion Laboratory, California Institute of Technology, under contract with the National Aeronautics and Space Administration. XUHONG YE and WENXIN YANG both acknowledge the support from the Chinese Scholarship Council.
References
- Abdo, A. A., Ackermann, M., Agudo, I., et al. 2010a, ApJ, 716, 30 [NASA ADS] [CrossRef] [Google Scholar]
- Abdo, A. A., Ackermann, M., Ajello, M., et al. 2010b, Science, 328, 725 [NASA ADS] [CrossRef] [Google Scholar]
- Abdo, A. A., Ackermann, M., Ajello, M., et al. 2010c, ApJ, 720, 912 [NASA ADS] [CrossRef] [Google Scholar]
- Abdollahi, S., Acero, F., Baldini, L., et al. 2022, ApJS, 260, 53 [NASA ADS] [CrossRef] [Google Scholar]
- Abdurro’uf, Accetta, K., Aerts, C., et al. 2022, ApJS, 259, 35 [NASA ADS] [CrossRef] [Google Scholar]
- Agudo, I., Liodakis, I., Otero-Santos, J., et al. 2025, ApJ, 985, L15 [Google Scholar]
- Ajello, M., Baldini, L., Ballet, J., et al. 2022, ApJS, 263, 24 [NASA ADS] [CrossRef] [Google Scholar]
- Angioni, R., Grandi, P., Torresi, E., Vignali, C., & Knödlseder, J. 2017, Astropart. Phys., 92, 42 [Google Scholar]
- Arnaudova, M. I., Smith, D. J. B., Hardcastle, M. J., et al. 2025, MNRAS, 542, 2245 [Google Scholar]
- Błażejowski, M., Sikora, M., Moderski, R., & Madejski, G. M. 2000, ApJ, 545, 107 [Google Scholar]
- Balasubramaniam, K., Stawarz, Ł., Cheung, C. C., et al. 2021, ApJ, 922, 84 [NASA ADS] [CrossRef] [Google Scholar]
- Baldi, R. D. 2023, A&ARv, 31, 3 [NASA ADS] [CrossRef] [Google Scholar]
- Baldi, R. D., & Capetti, A. 2010, A&A, 519, A48 [NASA ADS] [CrossRef] [EDP Sciences] [Google Scholar]
- Baldi, R. D., Chiaberge, M., Capetti, A., et al. 2010, ApJ, 725, 2426 [NASA ADS] [CrossRef] [Google Scholar]
- Baldi, R. D., Capetti, A., Buttiglione, S., Chiaberge, M., & Celotti, A. 2013, A&A, 560, A81 [NASA ADS] [CrossRef] [EDP Sciences] [Google Scholar]
- Baldi, R. D., Capetti, A., & Massaro, F. 2018, A&A, 609, A1 [NASA ADS] [CrossRef] [EDP Sciences] [Google Scholar]
- Baldi, R. D., Capetti, A., & Giovannini, G. 2019a, MNRAS, 482, 2294 [NASA ADS] [CrossRef] [Google Scholar]
- Baldi, R. D., Torresi, E., Migliori, G., & Balmaverde, B. 2019b, Galaxies, 7, 76 [NASA ADS] [CrossRef] [Google Scholar]
- Bassi, T., Migliori, G., Grandi, P., et al. 2018, MNRAS, 481, 5236 [Google Scholar]
- Baum, S. A., Heckman, T. M., & van Breugel, W. 1992, ApJ, 389, 208 [NASA ADS] [CrossRef] [Google Scholar]
- Best, P. N., & Heckman, T. M. 2012, MNRAS, 421, 1569 [NASA ADS] [CrossRef] [Google Scholar]
- Boccardi, B., Perucho, M., Casadio, C., et al. 2021, A&A, 647, A67 [NASA ADS] [CrossRef] [EDP Sciences] [Google Scholar]
- Borkar, A., Adhikari, T. P., Różańska, A., et al. 2021, MNRAS, 500, 3536 [Google Scholar]
- Boula, S., Mastichiadis, A., & Kazanas, D. 2026, A&A, 705, L5 [NASA ADS] [CrossRef] [EDP Sciences] [Google Scholar]
- Buttiglione, S., Capetti, A., Celotti, A., et al. 2009, A&A, 495, 1033 [NASA ADS] [CrossRef] [EDP Sciences] [Google Scholar]
- Buttiglione, S., Capetti, A., Celotti, A., et al. 2010, A&A, 509, A6 [NASA ADS] [CrossRef] [EDP Sciences] [Google Scholar]
- Buttiglione, S., Capetti, A., Celotti, A., et al. 2011, A&A, 525, A28 [NASA ADS] [CrossRef] [EDP Sciences] [Google Scholar]
- Capetti, A., Celotti, A., Chiaberge, M., et al. 2002a, A&A, 383, 104 [NASA ADS] [CrossRef] [EDP Sciences] [Google Scholar]
- Capetti, A., Trussoni, E., Celotti, A., Feretti, L., & Chiaberge, M. 2002b, New Astron. Rev., 46, 335 [Google Scholar]
- Capetti, A., Verdoes Kleijn, G., & Chiaberge, M. 2005, A&A, 439, 935 [NASA ADS] [CrossRef] [EDP Sciences] [Google Scholar]
- Capetti, A., Massaro, F., & Baldi, R. D. 2017a, A&A, 598, A49 [NASA ADS] [CrossRef] [EDP Sciences] [Google Scholar]
- Capetti, A., Massaro, F., & Baldi, R. D. 2017b, A&A, 601, A81 [NASA ADS] [CrossRef] [EDP Sciences] [Google Scholar]
- Cappellari, M., Neumayer, N., Reunanen, J., et al. 2009, MNRAS, 394, 660 [NASA ADS] [CrossRef] [Google Scholar]
- Cerruti, M. 2020, Galaxies, 8, 72 [NASA ADS] [CrossRef] [Google Scholar]
- Chen, L. 2018, ApJS, 235, 39 [NASA ADS] [CrossRef] [Google Scholar]
- Chen, Y.-Y., Zhang, X., Xiong, D., & Yu, X. 2015, AJ, 150, 8 [NASA ADS] [CrossRef] [Google Scholar]
- Chen, Y., Gu, Q., Fan, J., et al. 2023, ApJ, 944, 157 [Google Scholar]
- Chen, G., Zheng, Z., Zeng, X., et al. 2024, ApJS, 271, 20 [Google Scholar]
- Chen, G., Yang, W., Liu, Y., et al. 2025, MNRAS, 544, 1926 [Google Scholar]
- Chilufya, J., Hardcastle, M. J., Pierce, J. C. S., et al. 2025, MNRAS, 539, 463 [Google Scholar]
- Cid Fernandes, R., Stasińska, G., Schlickmann, M. S., et al. 2010, MNRAS, 403, 1036 [Google Scholar]
- de Bruyn, A. G. 1989, A&A, 226, L13 [NASA ADS] [Google Scholar]
- Dermer, C. D. 1995, ApJ, 446, L63 [NASA ADS] [CrossRef] [Google Scholar]
- Dermer, C. D., & Schlickeiser, R. 1993, ApJ, 416, 458 [Google Scholar]
- Di Mauro, M., Calore, F., Donato, F., Ajello, M., & Latronico, L. 2014, ApJ, 780, 161 [Google Scholar]
- Eracleous, M., & Halpern, J. P. 2003, ApJ, 599, 886 [NASA ADS] [CrossRef] [Google Scholar]
- Evans, I. N., Primini, F. A., Glotfelty, K. J., et al. 2010, ApJS, 189, 37 [NASA ADS] [CrossRef] [Google Scholar]
- Fan, J. H., Xie, G. Z., & Wen, S. L. 1996, A&AS, 116, 409 [NASA ADS] [CrossRef] [EDP Sciences] [Google Scholar]
- Fan, J., Yang, J. H., Zhang, J.-Y., et al. 2013, PASJ, 65, 25 [CrossRef] [Google Scholar]
- Fan, J. H., Yang, J. H., Liu, Y., et al. 2016, ApJS, 226, 20 [CrossRef] [Google Scholar]
- Fan, J. H., Kurtanidze, S. O., Liu, Y., et al. 2021, ApJS, 253, 10 [Google Scholar]
- Fan, J., Xiao, H., Yang, W., et al. 2023, ApJS, 268, 23 [Google Scholar]
- Fanaroff, B. L., & Riley, J. M. 1974, MNRAS, 167, 31P [Google Scholar]
- Filippenko, A. V. 1985, ApJ, 289, 475 [NASA ADS] [CrossRef] [Google Scholar]
- Finke, J. D., Dermer, C. D., & Böttcher, M. 2008, ApJ, 686, 181 [NASA ADS] [CrossRef] [Google Scholar]
- Foschini, L. 2012, Res. Astron. Astrophys., 12, 359 [Google Scholar]
- Fossati, G., Maraschi, L., Celotti, A., Comastri, A., & Ghisellini, G. 1998, MNRAS, 299, 433 [Google Scholar]
- Fu, W.-J., Zhang, H.-M., Zhang, J., et al. 2022, Res. Astron. Astrophys., 22, 035005 [Google Scholar]
- Ghisellini, G. 2011, Am. Inst. Phys. Conf. Ser., 1381, 180 [Google Scholar]
- Ghisellini, G., & Celotti, A. 2001, A&A, 379, L1 [NASA ADS] [CrossRef] [EDP Sciences] [Google Scholar]
- Ghisellini, G., & Tavecchio, F. 2009, MNRAS, 397, 985 [Google Scholar]
- Ghisellini, G., Padovani, P., Celotti, A., & Maraschi, L. 1993, ApJ, 407, 65 [Google Scholar]
- Ghisellini, G., Tavecchio, F., & Chiaberge, M. 2005, A&A, 432, 401 [CrossRef] [EDP Sciences] [Google Scholar]
- Ghisellini, G., Tavecchio, F., Foschini, L., et al. 2010, MNRAS, 402, 497 [Google Scholar]
- Ghisellini, G., Tavecchio, F., Foschini, L., & Ghirlanda, G. 2011, MNRAS, 414, 2674 [NASA ADS] [CrossRef] [Google Scholar]
- Ghisellini, G., Tavecchio, F., Maraschi, L., Celotti, A., & Sbarrato, T. 2014, Nature, 515, 376 [NASA ADS] [CrossRef] [Google Scholar]
- Ghisellini, G., Righi, C., Costamante, L., & Tavecchio, F. 2017, MNRAS, 469, 255 [NASA ADS] [CrossRef] [Google Scholar]
- Giommi, P., Padovani, P., Polenta, G., et al. 2012, MNRAS, 420, 2899 [NASA ADS] [CrossRef] [Google Scholar]
- Gonçalves, A. C., & Serote Roos, M. 2004, A&A, 413, 97 [NASA ADS] [CrossRef] [EDP Sciences] [Google Scholar]
- Grandi, S. A. 1983, MNRAS, 204, 691 [NASA ADS] [Google Scholar]
- Grandi, P. 2012, Int. J. Mod. Phys. Conf. Ser., 8, 25 [CrossRef] [Google Scholar]
- Grandi, P., Capetti, A., & Baldi, R. D. 2016, MNRAS, 457, 2 [NASA ADS] [CrossRef] [Google Scholar]
- Grandi, P., Torresi, E., Macconi, D., Boccardi, B., & Capetti, A. 2021, ApJ, 911, 17 [NASA ADS] [CrossRef] [Google Scholar]
- Grandi, P., Giovannini, G., Torresi, E., & Boccardi, B. 2025, A&A, 699, A286 [NASA ADS] [CrossRef] [EDP Sciences] [Google Scholar]
- Hardcastle, M. J., & Croston, J. H. 2020, New Astron. Rev., 88, 101539 [Google Scholar]
- Hardcastle, M. J., Evans, D. A., & Croston, J. H. 2007, MNRAS, 376, 1849 [NASA ADS] [CrossRef] [Google Scholar]
- Hardcastle, M. J., Lenc, E., Birkinshaw, M., et al. 2016, MNRAS, 455, 3526 [NASA ADS] [CrossRef] [Google Scholar]
- Heckman, T. M., & Best, P. N. 2014, ARA&A, 52, 589 [Google Scholar]
- Heckman, T. M., Kauffmann, G., Brinchmann, J., et al. 2004, ApJ, 613, 109 [Google Scholar]
- Hlabathe, M. S., Starkey, D. A., Horne, K., et al. 2020, MNRAS, 497, 2910 [NASA ADS] [CrossRef] [Google Scholar]
- Ho, L. C. 1999, ApJ, 516, 672 [NASA ADS] [CrossRef] [Google Scholar]
- Ho, L. C., Filippenko, A. V., & Sargent, W. L. W. 1997, ApJS, 112, 315 [NASA ADS] [CrossRef] [Google Scholar]
- Homan, D. C., Cohen, M. H., Hovatta, T., et al. 2021, ApJ, 923, 67 [NASA ADS] [CrossRef] [Google Scholar]
- Hu, J.-F., Cao, X.-W., Chen, L., & You, B. 2016, Res. Astron. Astrophys., 16, 136 [Google Scholar]
- Huang, L. H., Jiang, D. R., & Cao, X. 1999, A&A, 341, 74 [Google Scholar]
- Ineson, J., Croston, J. H., Hardcastle, M. J., et al. 2015, MNRAS, 453, 2682 [Google Scholar]
- Inskip, K. J., Tadhunter, C. N., Morganti, R., et al. 2010, MNRAS, 407, 1739 [Google Scholar]
- Janiak, M., Sikora, M., & Moderski, R. 2016, MNRAS, 458, 2360 [Google Scholar]
- Jones, D. H., Read, M. A., Saunders, W., et al. 2009, MNRAS, 399, 683 [Google Scholar]
- Kauffmann, G., Heckman, T. M., Tremonti, C., et al. 2003, MNRAS, 346, 1055 [Google Scholar]
- Keenan, M., Meyer, E. T., Georganopoulos, M., Reddy, K., & French, O. J. 2021, MNRAS, 505, 4726 [NASA ADS] [CrossRef] [Google Scholar]
- Kewley, L. J., Dopita, M. A., Sutherland, R. S., Heisler, C. A., & Trevena, J. 2001, ApJ, 556, 121 [Google Scholar]
- Khatiya, N. S., Boughelilba, M., Karwin, C. M., et al. 2024, ApJ, 971, 84 [Google Scholar]
- Kim, D.-W., & Fabbiano, G. 2003, ApJ, 586, 826 [NASA ADS] [CrossRef] [Google Scholar]
- Kollatschny, W., Kotulla, R., Pietsch, W., Bischoff, K., & Zetzl, M. 2008, A&A, 484, 897 [NASA ADS] [CrossRef] [EDP Sciences] [Google Scholar]
- Koss, M., Trakhtenbrot, B., Ricci, C., et al. 2017, ApJ, 850, 74 [Google Scholar]
- Laing, R. A., Jenkins, C. R., Wall, J. V., & Unger, S. W. 1994, ASP Conf. Ser., 54, 201 [NASA ADS] [Google Scholar]
- Lewis, K. T., & Eracleous, M. 2006, ApJ, 642, 711 [Google Scholar]
- Lian, J.-S., Wang, Z.-R., & Zhang, J. 2025, ApJ, 995, 38 [Google Scholar]
- Liodakis, I., Hovatta, T., Huppenkothen, D., et al. 2018, ApJ, 866, 137 [Google Scholar]
- Liodakis, I., Marscher, A. P., Agudo, I., et al. 2022, Nature, 611, 677 [CrossRef] [Google Scholar]
- Liodakis, I., Zhang, H., Boula, S., et al. 2025, A&A, 698, L19 [NASA ADS] [CrossRef] [EDP Sciences] [Google Scholar]
- López, I. E., Yang, G., Mountrichas, G., et al. 2024, A&A, 692, A209 [NASA ADS] [CrossRef] [EDP Sciences] [Google Scholar]
- Lusso, E., Comastri, A., Simmons, B. D., et al. 2012, MNRAS, 425, 623 [Google Scholar]
- Macconi, D., Torresi, E., Grandi, P., Boccardi, B., & Vignali, C. 2020, MNRAS, 493, 4355 [NASA ADS] [CrossRef] [Google Scholar]
- Makarov, D., Prugniel, P., Terekhova, N., Courtois, H., & Vauglin, I. 2014, A&A, 570, A13 [NASA ADS] [CrossRef] [EDP Sciences] [Google Scholar]
- Masetti, N., Parisi, P., Palazzi, E., et al. 2009, A&A, 495, 121 [NASA ADS] [CrossRef] [EDP Sciences] [Google Scholar]
- Massaro, F., Capetti, A., Paggi, A., et al. 2020, ApJ, 900, L34 [NASA ADS] [CrossRef] [Google Scholar]
- Meyer, E. T., Fossati, G., Georganopoulos, M., & Lister, M. L. 2011, ApJ, 740, 98 [Google Scholar]
- Mingo, B., Hardcastle, M. J., Croston, J. H., et al. 2014, MNRAS, 440, 269 [Google Scholar]
- Mingo, B., Croston, J. H., Best, P. N., et al. 2022, MNRAS, 511, 3250 [NASA ADS] [CrossRef] [Google Scholar]
- Mooney, S., Massaro, F., Quinn, J., et al. 2021, ApJS, 257, 30 [Google Scholar]
- Morganti, R., Oosterloo, T., Tadhunter, C. N., et al. 1999, A&AS, 140, 355 [NASA ADS] [CrossRef] [EDP Sciences] [Google Scholar]
- Noel-Storr, J., Baum, S. A., Verdoes Kleijn, G., et al. 2003, ApJS, 148, 419 [Google Scholar]
- Paliya, V. S. 2021, ApJ, 918, L39 [Google Scholar]
- Paliya, V. S., Domínguez, A., Ajello, M., Olmo-García, A., & Hartmann, D. 2021, ApJS, 253, 46 [NASA ADS] [CrossRef] [Google Scholar]
- Paliya, V. S., Saikia, D. J., Domínguez, A., & Stalin, C. S. 2024, ApJ, 976, 120 [Google Scholar]
- Paliya, V. S., Saikia, D. J., Bruni, G., Domínguez, A., & Stalin, C. S. 2025, ApJ, 989, 36 [Google Scholar]
- Pannikkote, M., Paliya, V. S., & Saikia, D. J. 2023, ApJ, 957, 73 [NASA ADS] [CrossRef] [Google Scholar]
- Raimundo, S. I., & Fabian, A. C. 2009, MNRAS, 396, 1217 [CrossRef] [Google Scholar]
- Robinson, A., Binette, L., Fosbury, R. A. E., & Tadhunter, C. N. 1987, MNRAS, 227, 97 [Google Scholar]
- Sadler, E. M., Ekers, R. D., Mahony, E. K., Mauch, T., & Murphy, T. 2014, MNRAS, 438, 796 [Google Scholar]
- Sbarrato, T., Ghisellini, G., Maraschi, L., & Colpi, M. 2012, MNRAS, 421, 1764 [Google Scholar]
- Sbarrato, T., Padovani, P., & Ghisellini, G. 2014, MNRAS, 445, 81 [NASA ADS] [CrossRef] [Google Scholar]
- Shakura, N. I., & Sunyaev, R. A. 1973, A&A, 24, 337 [NASA ADS] [Google Scholar]
- Shields, G. A., Oke, J. B., & Sargent, W. L. W. 1972, ApJ, 176, 75 [Google Scholar]
- Sikora, M., Begelman, M. C., & Rees, M. J. 1994, ApJ, 421, 153 [Google Scholar]
- Sikora, M., Stawarz, Ł., & Lasota, J.-P. 2007, ApJ, 658, 815 [NASA ADS] [CrossRef] [Google Scholar]
- Simpson, C., & Meadows, V. 1998, ApJ, 505, L99 [NASA ADS] [CrossRef] [Google Scholar]
- Stickel, M., Padovani, P., Urry, C. M., Fried, J. W., & Kuehr, H. 1991, ApJ, 374, 431 [Google Scholar]
- Tadhunter, C. 2008, New Astron. Rev., 52, 227 [Google Scholar]
- Torresi, E., Balmaverde, B., Liuzzo, E., et al. 2022, Mem. Soc. Astron. It., 93, 81 [Google Scholar]
- Tremaine, S., Gebhardt, K., Bender, R., et al. 2002, ApJ, 574, 740 [NASA ADS] [CrossRef] [Google Scholar]
- Ulgiati, A., Padovani, P., Giommi, P., Paiano, S., & Pinto, C. 2025, MNRAS, 543, 326 [Google Scholar]
- Urry, C. M., & Padovani, P. 1995, PASP, 107, 803 [NASA ADS] [CrossRef] [Google Scholar]
- van den Bosch, R. C. E. 2016, ApJ, 831, 134 [NASA ADS] [CrossRef] [Google Scholar]
- Vermeulen, R. C., & Cohen, M. H. 1994, ApJ, 430, 467 [NASA ADS] [CrossRef] [Google Scholar]
- Werner, P. N., Worrall, D. M., & Birkinshaw, M. 2000, MNRAS, 317, 105 [Google Scholar]
- Willett, K. W., Stocke, J. T., Darling, J., & Perlman, E. S. 2010, ApJ, 713, 1393 [NASA ADS] [CrossRef] [Google Scholar]
- Wills, B. J., Wills, D., Breger, M., Antonucci, R. R. J., & Barvainis, R. 1992, ApJ, 398, 454 [NASA ADS] [CrossRef] [Google Scholar]
- Wu, X.-B., & Liu, F. K. 2004, ApJ, 614, 91 [NASA ADS] [CrossRef] [Google Scholar]
- Xiao, H. B., Zhu, J. T., Fan, J. H., et al. 2022, MNRAS, 517, 4202 [Google Scholar]
- Xie, Z. H., & Zhang, L. 2012, PASJ, 64, 33 [Google Scholar]
- Xu, Y.-D., Cao, X., & Wu, Q. 2009, ApJ, 694, L107 [Google Scholar]
- Yang, J. H., Fan, J. H., Liu, Y., et al. 2022a, ApJS, 262, 18 [Google Scholar]
- Yang, W. X., Wang, H. G., Liu, Y., et al. 2022b, ApJ, 925, 120 [Google Scholar]
- Ye, X.-H., Baldi, R. D., Chen, Y.-Y., Bastieri, D., & Fan, J.-H. 2025, A&A, 697, A176 [NASA ADS] [CrossRef] [EDP Sciences] [Google Scholar]
- Yuan, Y. H., Du, G. J., Fan, J. H., et al. 2023, ApJS, 269, 60 [Google Scholar]
- Zhang, L. Z., Fan, J.-H., & Cheng, K.-S. 2002, PASJ, 54, 159 [Google Scholar]
- Zhang, L., Chen, S., Xiao, H., Cai, J., & Fan, J. 2020, ApJ, 897, 10 [Google Scholar]
- Zhang, H., Böttcher, M., & Liodakis, I. 2024, ApJ, 967, 93 [NASA ADS] [Google Scholar]
- Zhao, X. Z., Yang, H. Y., Zheng, Y. G., & Kang, S. J. 2024, ApJ, 967, 104 [Google Scholar]
The λEdd = Lbol/LEdd is a commonly used proxy for the accretion rate and is a dimensionless Eddington ratio between the bolometric luminosity and the Eddington luminosity, LEdd = 1.38 × 1038(M/M⊙) erg/s, in which M/M⊙ is the black hole (BH) mass in the unit of the solar mass (e.g., Raimundo & Fabian 2009).
The Doppler factor is defined by the Lorentz factor (Γ) and the jet viewing angle (θ), δ = (Γ(1 − β cos θ))−1, and  , where β is the bulk velocity in the unit of the speed of light (β = v/c).
We group narrow-lined HERGs and broad-lined radio galaxies (BLRGs) together, as BLRGs represent type-I HERGs whose broad permitted lines are visible in optical spectra (e.g. Morganti et al. 1999; Buttiglione et al. 2010; Baldi et al. 2013; Mingo et al. 2014; Sadler et al. 2014; Ineson et al. 2015; Macconi et al. 2020; Boccardi et al. 2021).
SDSS website: www.sdss.org
The Energetic Gamma-Ray Experiment Telescope.
The Spearman partial rank correlation coefficient estimates the correlation between two variables while accounting for the influence of a third. If variables A and B are both correlated with variable z, the partial correlation is given by  .
.
p = 2 + α is for a continuous jet model, and p = 3 + α is for a spherical jet model (Ghisellini et al. 1993; Urry & Padovani 1995).
Appendix A: Tables A.1 and A.2
Parameters for Fermi radio galaxies with the classification based on the BPT diagram.
Parameters for Fermi radio galaxies with the classification based on the partial spectral information.
All Tables
Parameters for Fermi radio galaxies with the classification based on the BPT diagram.
Parameters for Fermi radio galaxies with the classification based on the partial spectral information.
All Figures
|
Fig. 1. Relation between the γ-ray luminosities (Lγ) and γ-ray photon indices (Γγ). The green triangle is for LERGs, the green square is for FR 0 LERGs, and the black pentagram is for HERGs. BL Lacs are in red diamonds, while FSRQs are in blue circles. |
| In the text | |
|
Fig. 2. BPT diagnostic diagram showing the emission-line ratios log([N II]/Hα) versus log([O III]/Hβ) for the SDSS-selected sample. The demarcation curves from Kauffmann et al. (2003), Kewley et al. (2001), and Cid Fernandes et al. (2010) are shown to separate star-forming, composite, LERG, and HERG regimes. Sources located below the dash–dotted orange line are classified as LERGs (green triangles), while those above are classified as HERGs (black pentagons). |
| In the text | |
|
Fig. 3. Distribution of the CDs for blazars (upper panel) and radio galaxies (lower panel). Both of them scale into the same bin. |
| In the text | |
|
Fig. 4. Relation between the CD and the γ-ray photon indices (Γγ). The labels are the same as Fig. 1. The solid red line is the linear regression for BL Lacs [Γγ = (0.27 ± 0.03) logCD + (2.13 ± 0.02)], and the dashed blue line is the linear regression for FSRQs [Γγ = (0.08 ± 0.02) logCD + (2.43 ± 0.01)]. |
| In the text | |
|
Fig. 5. Distribution of the accretion rates (Lbol/LEdd) for blazars (upper panel) and radio galaxies (lower panel). Both of them scale into the same bin. |
| In the text | |
|
Fig. 6. Relation between the γ-ray luminosities, Lγ, and the bolometric luminosities, Lbol (upper panel), or the accretion rate, Lbol/LEdd (lower panel), for blazars and radio galaxies. The labels are the same as Fig. 1. |
| In the text | |
|
Fig. 7. Relation between the accretion rates (Lbol/LEdd) and γ-ray photon indices (Γγ). The labels are the same as Fig. 1. |
| In the text | |
Current usage metrics show cumulative count of Article Views (full-text article views including HTML views, PDF and ePub downloads, according to the available data) and Abstracts Views on Vision4Press platform.
Data correspond to usage on the plateform after 2015. The current usage metrics is available 48-96 hours after online publication and is updated daily on week days.
Initial download of the metrics may take a while.