Open Access
Fig. 10.
Download original image
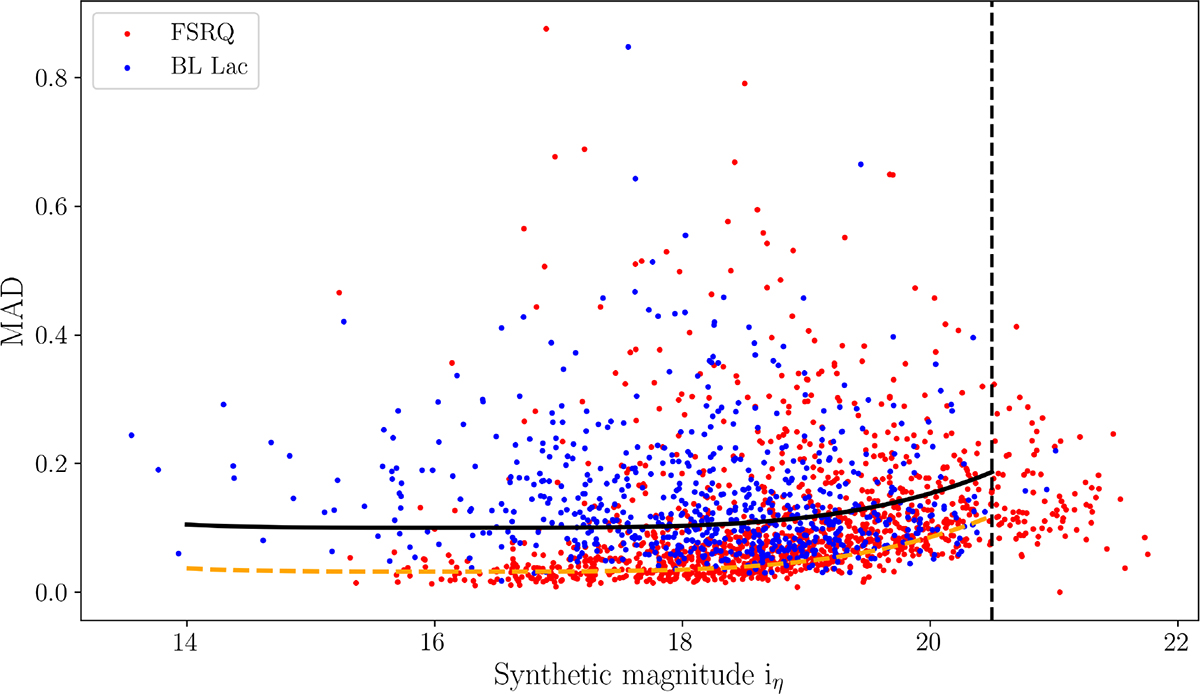
Distribution of MAD for the quasar and BZCAT sample. We also plot MAD as a function of median magnitude for the QSOs in the SDSS DR16 catalog (orange curve) and the ![]() threshold (black curve).
threshold (black curve).
Current usage metrics show cumulative count of Article Views (full-text article views including HTML views, PDF and ePub downloads, according to the available data) and Abstracts Views on Vision4Press platform.
Data correspond to usage on the plateform after 2015. The current usage metrics is available 48-96 hours after online publication and is updated daily on week days.
Initial download of the metrics may take a while.