Fig. 7.
Download original image
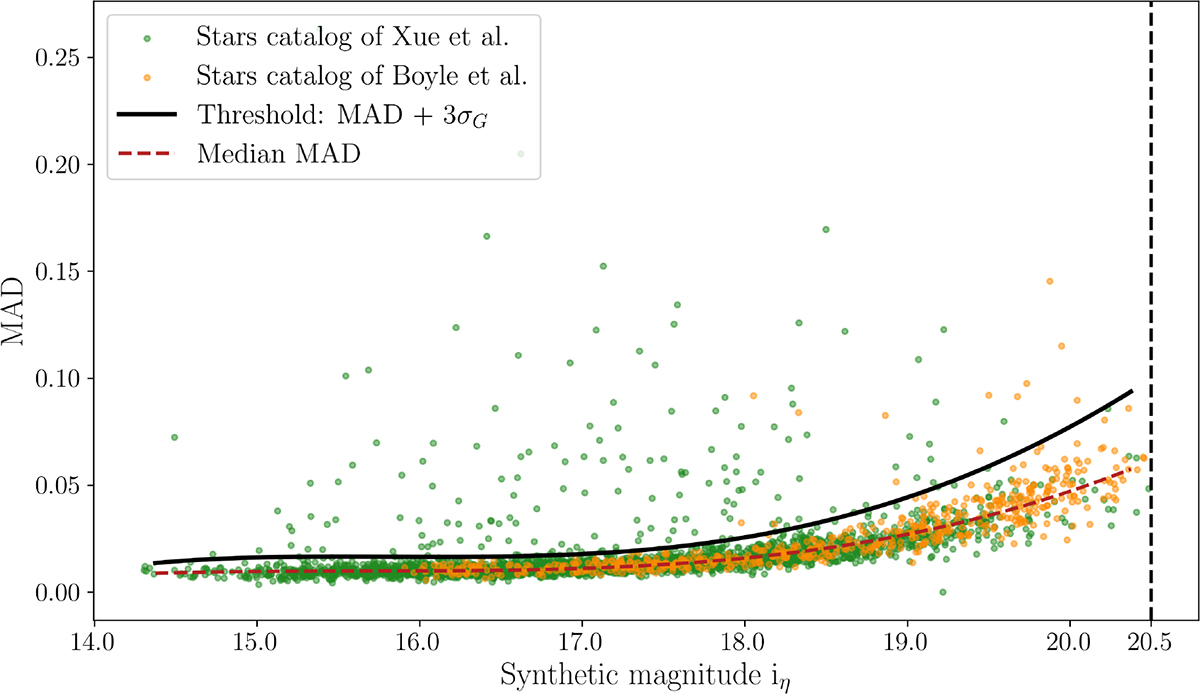
Distribution of MAD as a function of median synthetic magnitude (iη) for stars in the training sample. The dashed red curve shows the median MAD at varying median magnitudes, while the black curve shows the threshold for selecting optically variable sources (i.e., ![]() ). This threshold was estimated from the median MAD per magnitude bin plus three times the robust standard deviation (σG = 1.4826 × MAD) within each bin, interpolated using a fourth-order polynomial law. The vertical dashed black line marks the brightness limit at magnitude 20.5, beyond which noise increases significantly. The vertical dashed light lines indicate the binning used in the analysis.
). This threshold was estimated from the median MAD per magnitude bin plus three times the robust standard deviation (σG = 1.4826 × MAD) within each bin, interpolated using a fourth-order polynomial law. The vertical dashed black line marks the brightness limit at magnitude 20.5, beyond which noise increases significantly. The vertical dashed light lines indicate the binning used in the analysis.
Current usage metrics show cumulative count of Article Views (full-text article views including HTML views, PDF and ePub downloads, according to the available data) and Abstracts Views on Vision4Press platform.
Data correspond to usage on the plateform after 2015. The current usage metrics is available 48-96 hours after online publication and is updated daily on week days.
Initial download of the metrics may take a while.