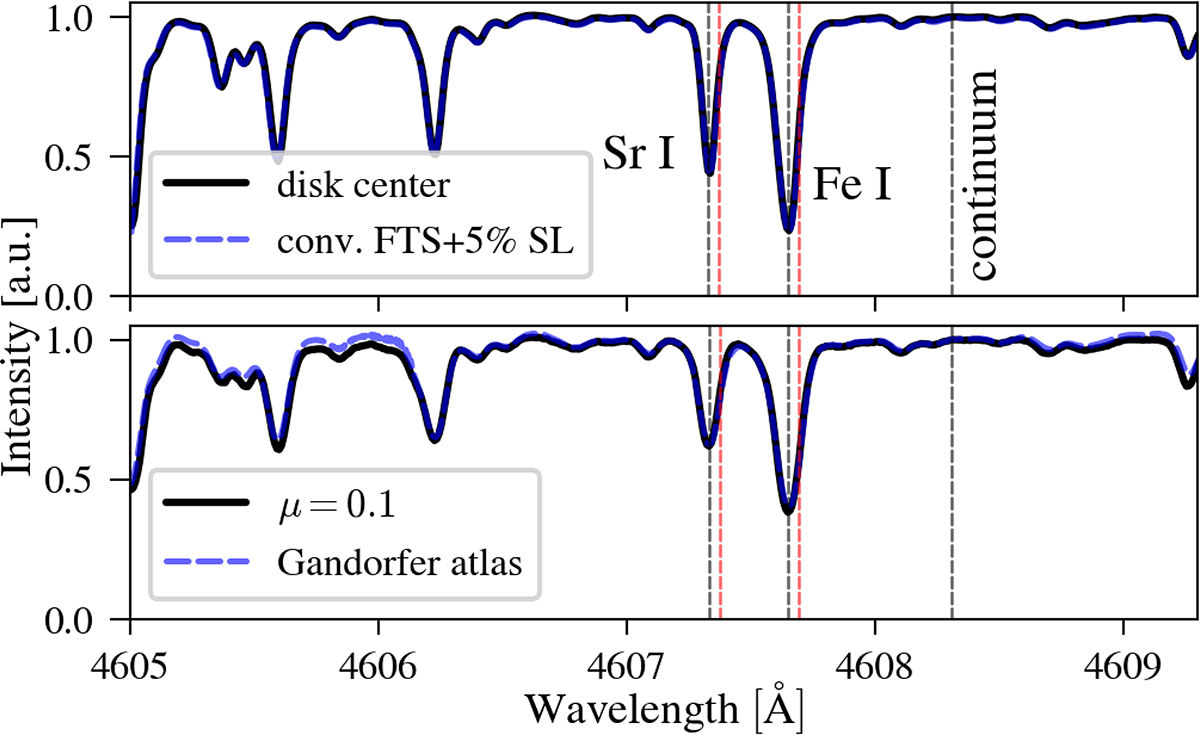
Fig. 1.
Download original image
Intensity spectra at disk center and close to the limb compared to the FTS atlas (Neckel 1999, convolved with a 10 mÅ Gaussian and adding 5% stray light) and the Second Solar Spectrum atlas (Gandorfer 2002), respectively. Vertical dashed black lines indicate the spectral positions of the line cores (Sr I and Fe I) and the selected continuum position. Vertical red lines indicate the wavelength positions of the red wing where Stokes V/I is plotted later in the paper. We normalized each spectrum to the continuum.
Current usage metrics show cumulative count of Article Views (full-text article views including HTML views, PDF and ePub downloads, according to the available data) and Abstracts Views on Vision4Press platform.
Data correspond to usage on the plateform after 2015. The current usage metrics is available 48-96 hours after online publication and is updated daily on week days.
Initial download of the metrics may take a while.