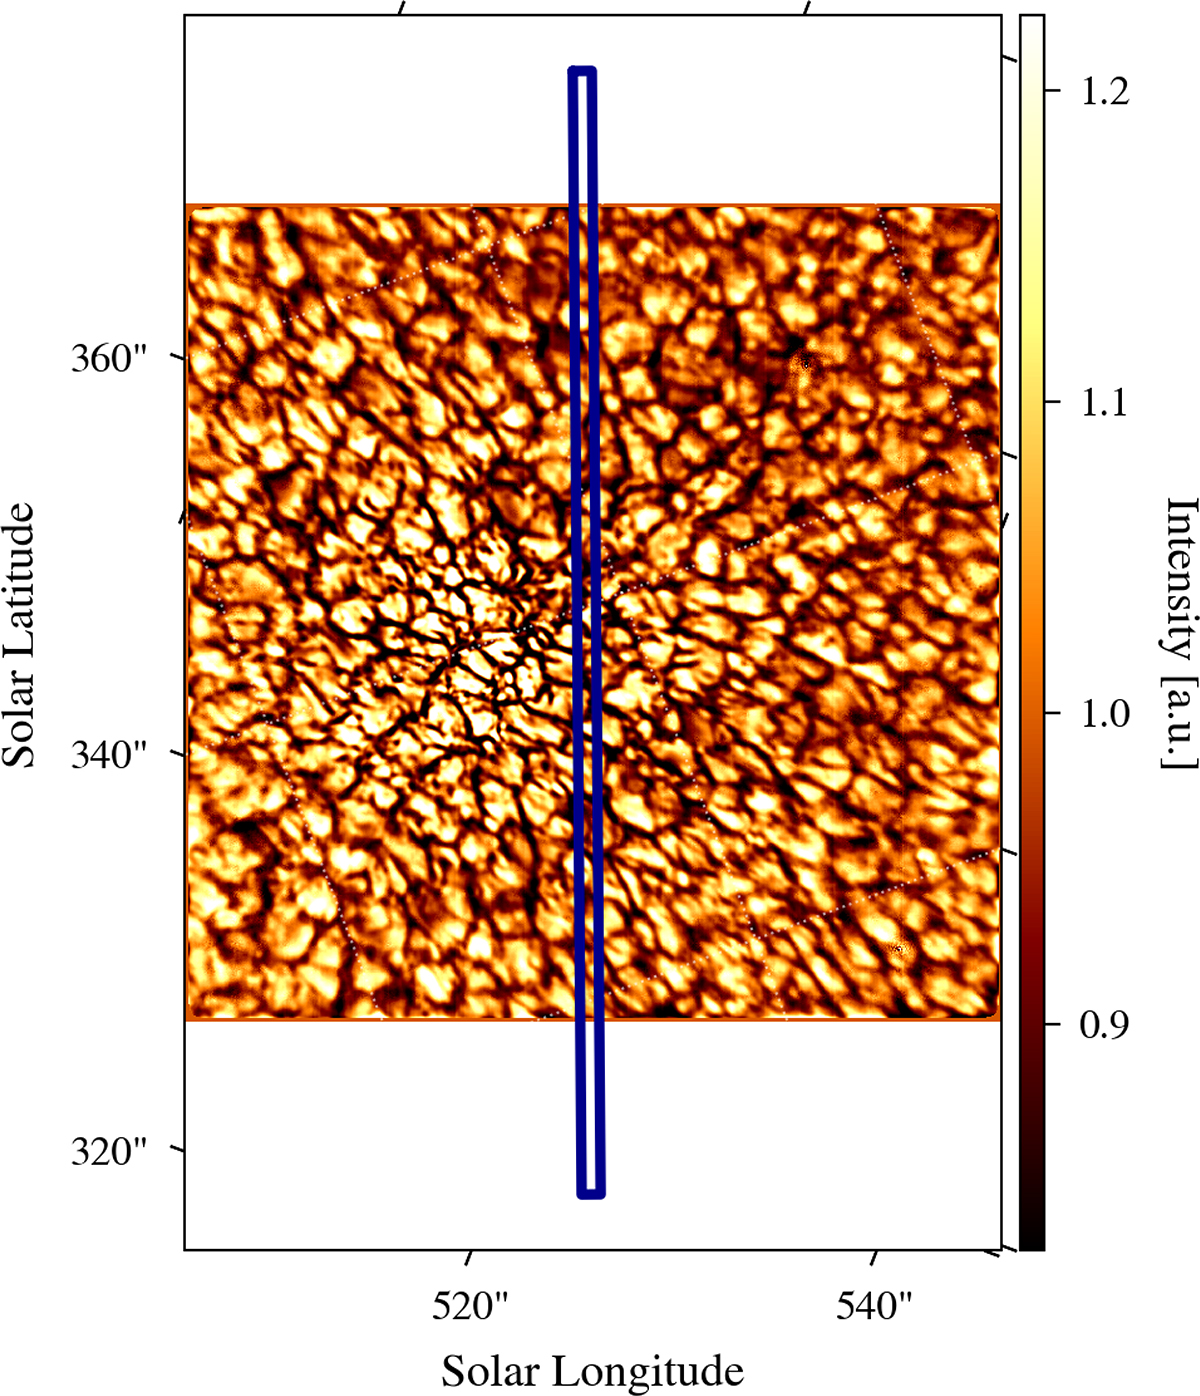
Fig. B.1.
Download original image
Co-temporal VBI context image at 4500 Å corresponding to the dataset at μ = 0.74, averaged over all frames belonging to the analyzed scan (10 min). The region scanned by ViSP is indicated in blue. Due to uncertainties in both the VBI coordinate accuracy and the co-alignment between VBI and ViSP, the indicated region is only approximate and intended for illustrative purposes.
Current usage metrics show cumulative count of Article Views (full-text article views including HTML views, PDF and ePub downloads, according to the available data) and Abstracts Views on Vision4Press platform.
Data correspond to usage on the plateform after 2015. The current usage metrics is available 48-96 hours after online publication and is updated daily on week days.
Initial download of the metrics may take a while.